Data is messy. It's a fact we all need to face as analysts. That's why analysts need a data transformation process. Business intelligence tools work best when data is not messy. A big part of an analyst's job is to clean data. And it's the least favorite activity, too.
Analysts know that clean data will make their lives easy during the analysis phase. Good analysts will dig in with a data transformation process to ensure that their data is as clean as possible.
But what makes data clean or dirty? After all, data is data, isn't it? And who is the authority on saying what clean data even means?
It turns out there are data standards and committees to guide people in transforming data into appropriate formats for their analysis. But for this article, we won't need to explain these formal processes in any great detail. We'll cover the basics of data transformation, that is, just enough to gain an understanding of the challenges associated with it.What Does Good Data Look Like?
Let's start by showing what good data looks like. Then, we'll see what data commonly looks like. And we'll determine the best way to get from the common to the good.
We'll use a fictitious sales system that I created in Excel. By the way, Excel will be a rather common format for your data. Many companies have years of business data contained in spreadsheets. You probably have plenty of your own.
Related: The Ultimate Guide to Cleaning Data
A sales system often contains orders, customers, products, and categories. Many systems have even more entities like countries, regions, salespeople, etc. But let's keep it simple. Besides, the concepts are the same, no matter how many entities exist.
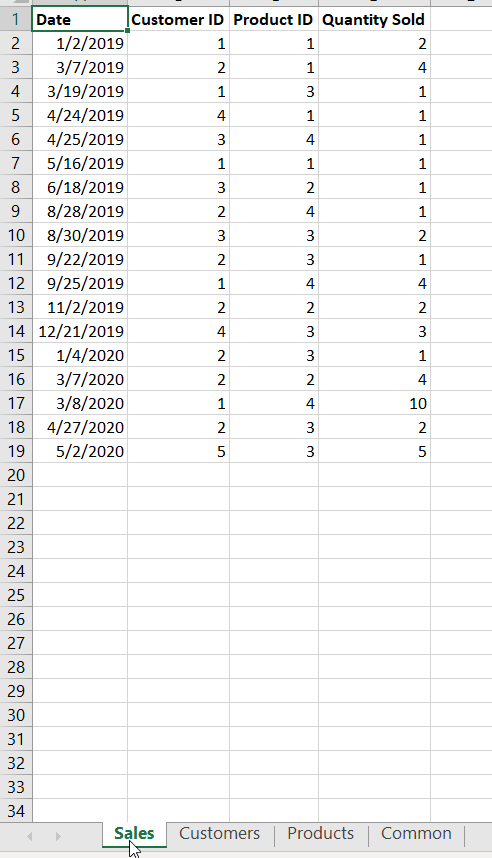
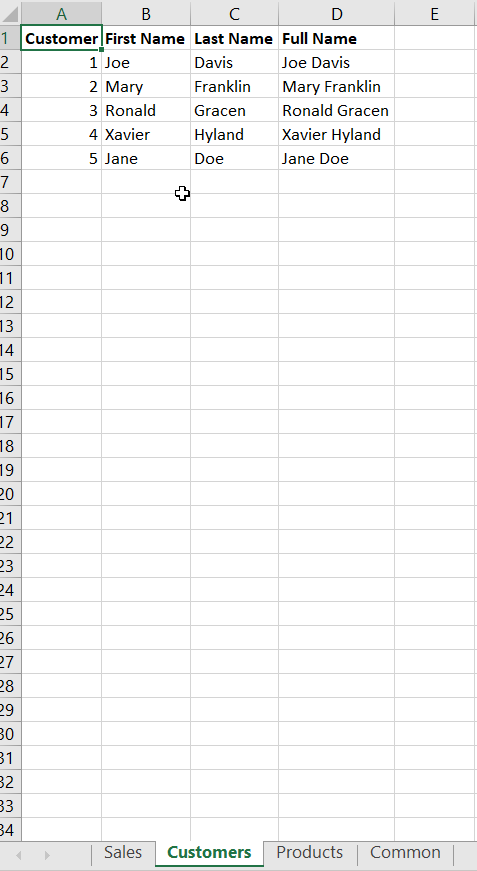
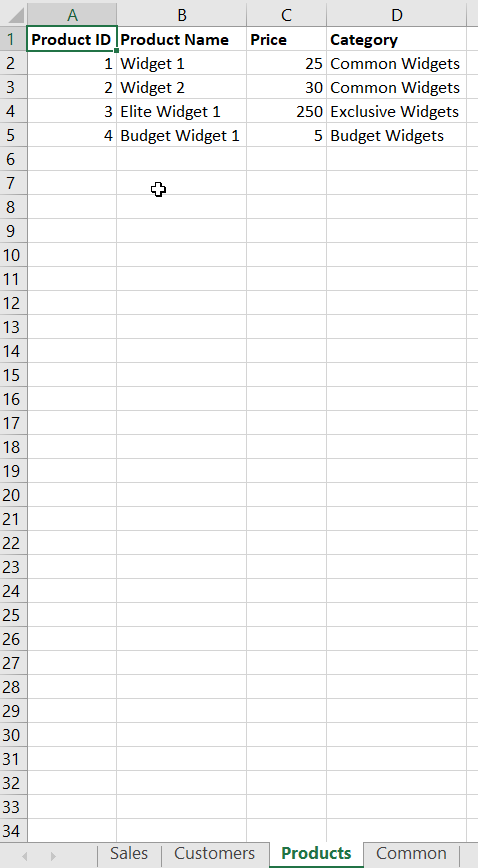
In a perfect world, we'd have worksheets or tables associated with each entity and a way to tie them together. With our scenario, we'd have worksheets for Sales, Customers, and Products. Again, if you had other entities like regions, there would be a worksheet for that, too.
The worksheets would look something like the following:
Sales
Customers
Products
NOTE: sales and orders are often interchangeable, although some companies will differentiate between them. It's something to keep in the back of your mind if you encounter the situation.
The Sales table looks cryptic. But that is the format that most analytics tools prefer. You'd need to match each number in the Customers and Products columns with their corresponding worksheets.
Related: How to Generate Mock Sales Data
The Common Format
The clean format works best for analysis because most analysis software stores the data in columns rather than rows. This is more efficient for looking up information because you don't have the overhead of repeated customer names or product names and any other data that is tacked onto a spreadsheet. Let's take a look at how business owners would set up a common worksheet:
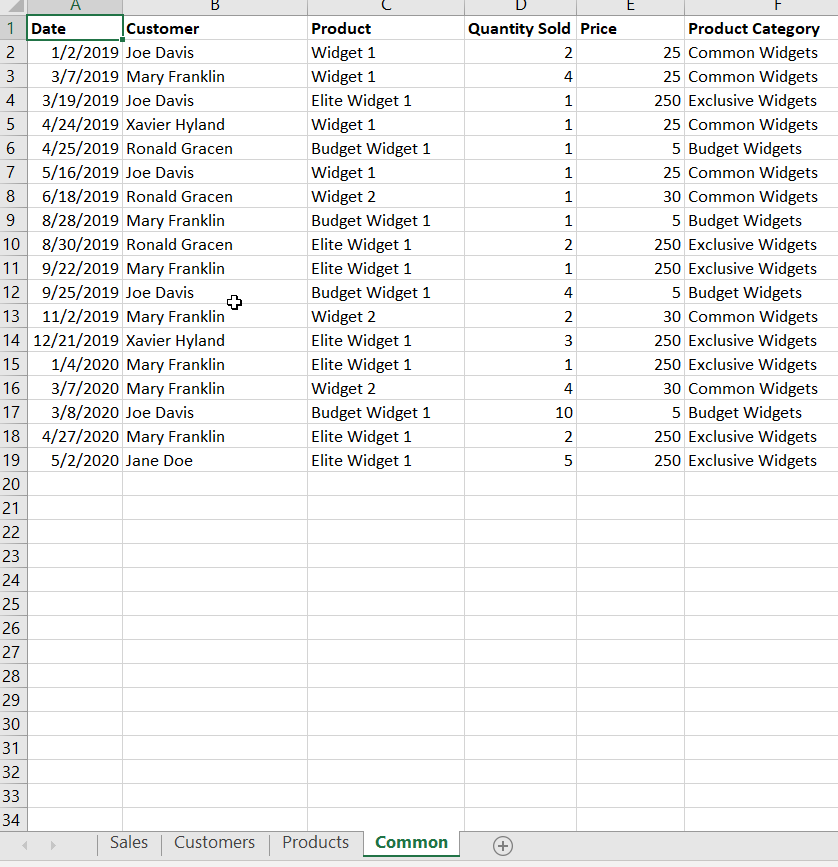
With the common format, the business owner can quickly view all the information about sales.
Should Business Owners Enter Data Differently?
At this point, you may think this is an article on how to convince business owners to change their evil ways and start entering data so that it is clean to start. First off, good luck with that. Could you imagine the conversation you'd have trying to tell a busy entrepreneur that they are entering their data wrong? Also, do you believe that the "clean" way would be easy for them to manage? Spreadsheets are meant to capture data quickly, not create more work.
We're stuck with the common way of data entry, and I wouldn't even try to advocate for spreadsheet users to change.
Data Transformation to the Rescue
Luckily, we don't have to badger business owners to make changes to their data entry procedures. The analysis tools will do most of the work for us. I'll save the details on how to transform data (the topic is huge) for other future articles.
Size (of Data) Matters
You've likely heard, or will hear, about big data. The definitions vary as to what the term means. But let's just accept that big data means a lot of data. And big data is why we make such a fuss about data formats and transformation.
The truth is for the small amount of data that we reference in this example, transforming data won't provide much bang for the buck. It may help in eliminating errors (the same customer spelled differently, etc.) But it won't provide any speed advantages.
When you start getting into millions of rows, however, clean data is going to be your best friend. Analytics tools try to optimize any data they use. But putting the data into an optimal format just makes their job that much easier. And it benefits you, the analyst.
Conclusion
I don't want to clutter this article describing how to clean data. The purpose of this article was to illustrate why having clean data is important. I have plans for several articles on how to clean it in the coming weeks and months. But hopefully, this article gives you some insight into the challenges associated with analyzing data and why transformation is worth the effort.
