At some point, you'll need to create lookup tables from data sources. Excel users often clump all entities together in each row. This is a natural way for them to view the data and it's the easiest for them to enter it this way. You'll likely find customer names and addresses, product names, prices and quantities sold, etc., repeated on each row of the spreadsheet.
The format these Excel users implement is not a natural fit for business intelligence (BI) tools. This is why these tools include Edit, Transform, and Load (ETL) functions. They can help place the data in the format that the BI tool works best. For this, you'll need to to learn how to create lookup tables from fact tables in Power BI.

The sample file we'll use for this tutorial is an Excel file. It is short by design: to help you understand the concepts without dealing with large files. This will serve as the fact table mentioned in the beginning of this tutorial. Here is the source to download:
Overview
In many cases, files you'll load in from clients or at work will contain data in the wrong format for Power BI to work optimally. The data usually contains every bit of information that a client or boss deals with.
For example, spreadsheets with sales information often contains the order number, order date, customer id and customer name, sometimes even the address of the customer. The order line item may contain the product id and name, the category, etc.
As you can imagine, the information is repeated for the purchase of similar products or if a customer is a repeat buyer. Take a look at the following:

This spreadsheet is the data we'll be working with for the tutorial. The Customer name is repeated several times (See Mary Resnor, etc.). The product name is repeated, too (look at Apple iPhone 5, etc.)
The spreadsheet is available for download earlier in this tutorial.
While the impact of repeating these values may not be too great with a data sample as small as this spreadsheet, the large files will start to become unwieldy. Imagine if the user misspelled a word in one of the product names that gets repeated.
The bad news is that the clients or owners of these spreadsheets will likely continue entering their data in the above spreadsheet format. No amount of processing by Power BI can prevent that from happening.
But the processing (known as ETL) can detect when it occurs and if you set rules ahead of time, you can reduce the number of these errors automically via the ETL process. This is an advanced topic however.
Most of the time, the owners of these spreadsheets will copy a previous entry to make sure that it does get copied properly.
Spreadsheet Owners Won't Change their Data-Entry Procedures
There's a good bet that the owners of these spreadsheets will not change how they enter their data. That requires a lot of revamping of the procedures and of the spreadsheet itself.
But this format will not work well in Power BI. It's possible, but you'll have a lot of work to do any time you make changes to your dashboard or reports. It also will prevent the assets that Power BI uses from working properly.
A small amount of effort during the ETL process can go a long way in making your life easier during design.
How the Tutorial Is Structured
If you notice from the spreadsheet above, there are four tables-in-one. You could likely find even more, but sometimes you can take the concept a bit too far. However, once you learn these techniques, you are welcome to use them as you see fit.
You could, for instance, break out the orders into an sales master and sales detail table. But for the purposes of this tutorial, we'll stick with the four tables.
The tables are as follows:
- Sales
- Customers
- Products
- Sales Type
Sales
All the sales information is contained in the spreadsheet. Once we process the other tables, what's left over in the main table will be the sales information.
To start the process, the first step is to load the data. It's a Microsoft Excel file called Sample Data.xlsx. Load the file as follows:


You'll notice the name of the is called Transactions. You are welcome to leave that name. For this tutorial, we'll rename it to Sales.

After the data is loaded, click on the Transform Data tab. Note - you could have clicked on the Transform Data in the Load screen to arrive at the same option.

Change the name of the table from Transactions to Sales.


Customers
We'll now duplicate the Sales table to use as our new customer table. The concept is to create a duplicate of the entire table and only keep the columns that we need, in this case, the ones related to customers.
Locate the Sales table (the one you renamed from Transactions) and right-click on it. Then, you'll see an option called Duplicate. Click on that option.

In the new table called Sales (2), select both the Customer ID and the Customer Name columns.

Select the Remove Columns and then the Remove Other Columns option. This will remove all columns that are not selected, leaving only the Customer ID and the Customer Name.

We have made some progress, but you may notice one issue - some of the rows are duplicates. We'll need to remove those duplicates. Luckily, in Power BI, the is easy.
Select the Customer ID column and right-click. Then, select the remove duplicates option.


As customer information is the only information contained in this table, let's rename the table to Customers. You can call the table whatever you like, including Customer_Lookup, etc.

Click on the main Sales table. You'll notice the Customer Name is still in this table. We don't need this anymore because this information is now contained in the Customers table. We use the Customer ID to link them (when set up correctly, Power BI handle this internally).
Select the Customer Name column, right-click and select the Remove option.


Table relationhips are established using some common bond, usually a key. When we duplicated the sales table and kept only the customer information, one of those columns is the Customer ID. Since the Customer ID still exists in the sales table, this is the common bond we need to "glue" the tables together.
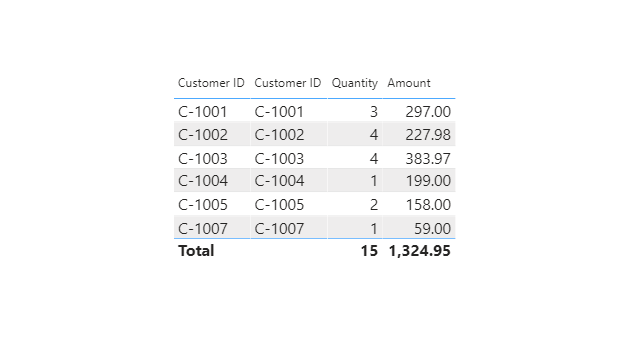
Once the relationships are established, Power BI will know what to do with them. If you included the Customer ID from the Sales table in your reports, it will provide you with exactly the same information as when you include the Customer ID from the Customer table.
To illustrate this, I added the Customer ID from both tables (Sales and Customers) into a matrix control. Then I added the Quantity and Amount columns from the Sales table:

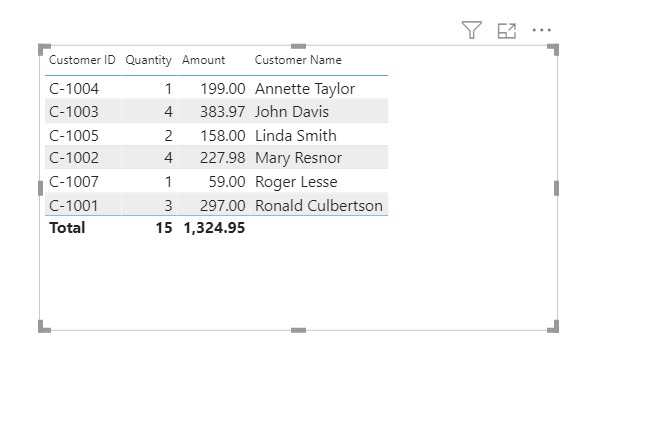
What this also means, however, is that we can include the Customer Name into the report, and Power BI will know how to make the connection.

The report shown includes the Customer ID from the Sales table and the Customer Name from the Customers table. Other than establishing those relationships, there is nothing that you needed to do to make this connection. This is part of the POWER in Power BI.
The dynamics of how table relationships work is beyond the scope of this tutorial (due to time restrictions). However, you'll find great tutorials on the internet that describe how to set up the relationships properly.
As an experiment, you can try deleting the relationship between Customers and Sales. See how the report components react.
Products
This section will be shorter as the process is exactly the same. You'll duplicate the sales table, remove all columns except for the Product ID and the Product Name. Remove the duplicates (after seleting the Product ID column) and remove the Product Name from the Sales table. Then, rename the Sales (2) table to Products.
I'll show the images without adding too much commentary just because it's the same process as customers. Trust me! When you do this once (Customers) you'll have no struggles with doing it for Products.


Sales Types
Creating a Sales Type table from Sales is somewhat trickier than the other two tables (Customers and Products). However, when you follow these instructions, you should be able to grasp it quickly.
What makes this process trickier is that there is not key to match against like there were for Customers and Products. There is nothing to associated the Sales Types to a new table.
In other words, once you dulicate the Sales table and delete all the columns (except for the Type), you have not established any field that can be used to establish a relationship.
You may argue that the Type field is your relationship. But it makes no sense to offload information that exists in a table from information that is already in the original table. If you were to extract Type into a separate table and then use Type to tie it back to the Type is the Sales table, you are doing work for nothing.
Here is a summary of the process (the beginning is similar to the previous tables):
Create a duplicate of the Sales table.
Remove all the columns except for the Type column.
Select the Type column (it should be the only column at this point)
Right-click and select the Remove Duplicates option.
Add index values to the table. Be sure to do this after removing duplicates. Rename this index Sales Type ID.
Merge the table back into the Sales table.
Specify how you want the post-merge to handle the naming of the new columns.
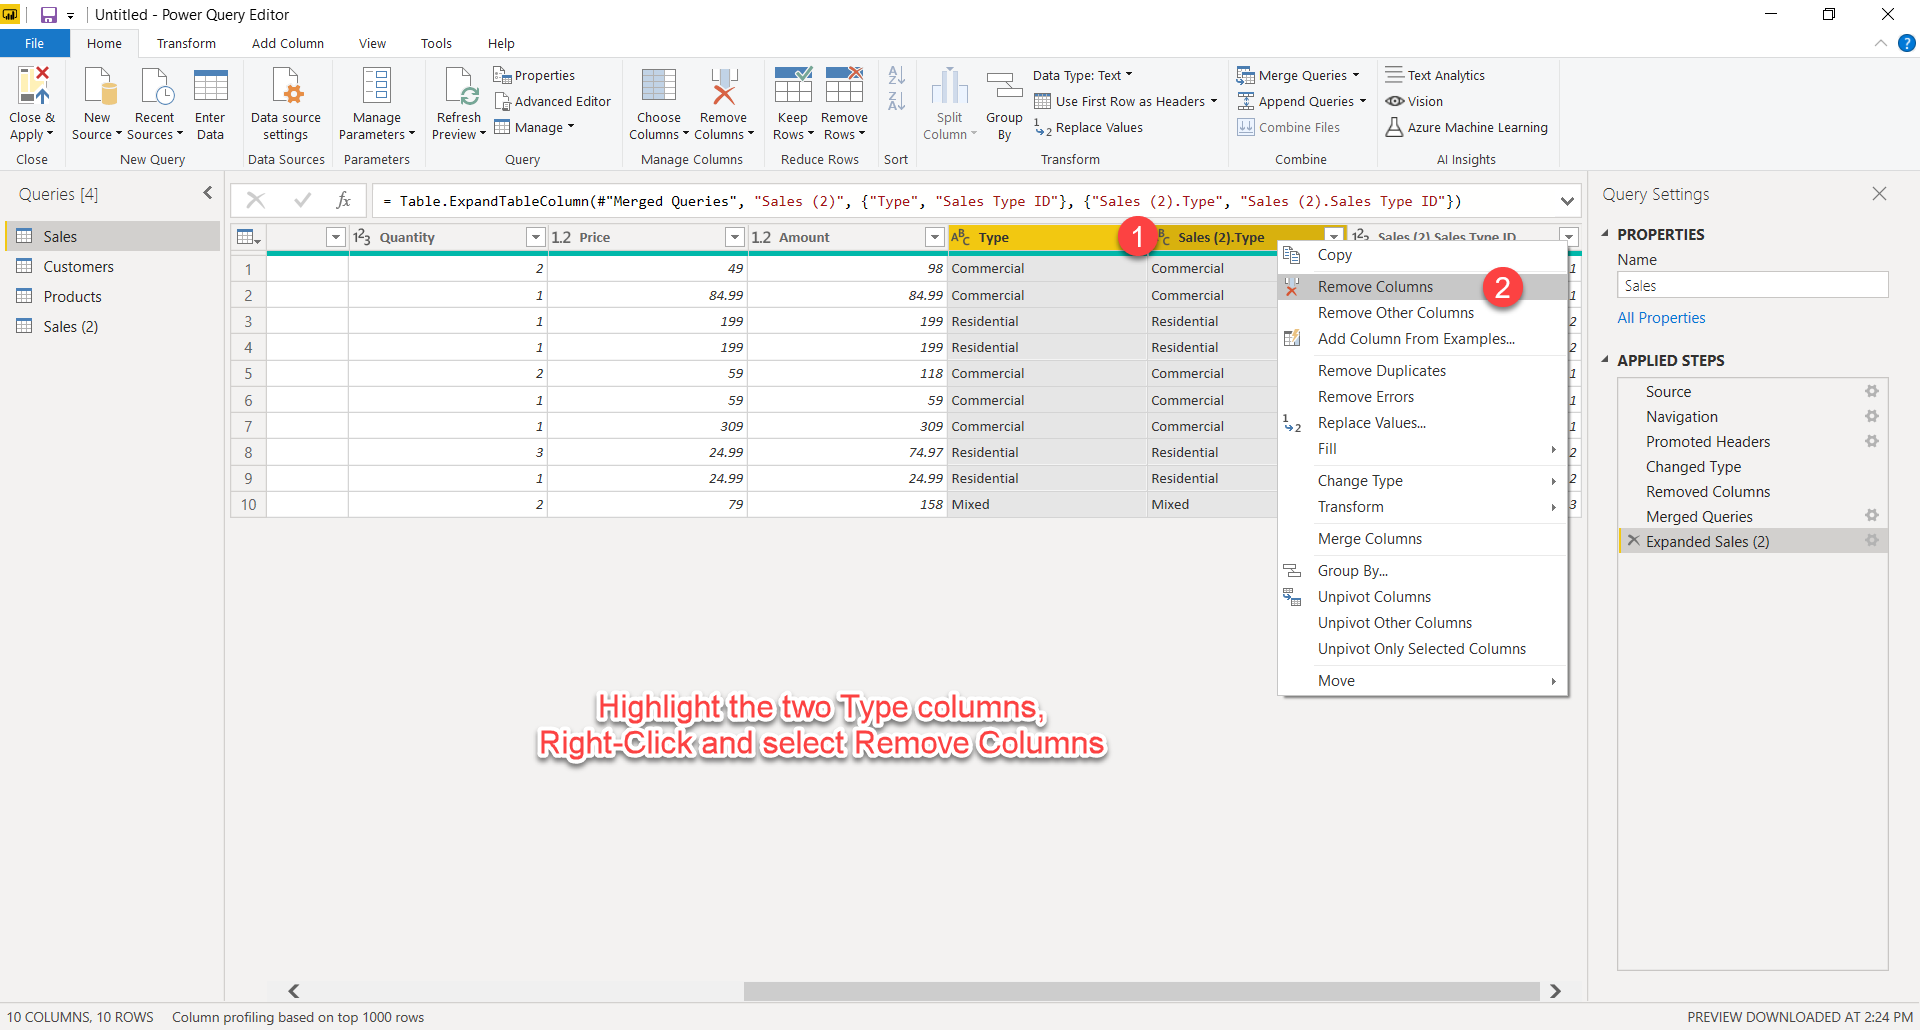
Delete the two Type columns, but not the Type ID (the index that got merged back into sales).
Rename the merged type ID to Sales Type ID.
Rename the Sales (2) Table to Sales Type.
Let's go into more detail for this process. Note - the steps before creating an index is similar to the Customers and Products. There won't be any comments for these steps.


A shown in the graphic, the alternative method (which leads to the same results) is to right-click on the column and choose the Remove Other Columns option. Neither is better than the other. Just two ways to accomplish the same goal.


From this point on, I'll need to include additional instructions to help with your understanding of the method.
Now that we have a unique set of Types, we can add the index. Adding an index creates unique id's that can be used to tie back the Sales Types to the Sales table.

Step 1 - Select the Add Columns tab.
Step 2 - Look for the Index Column Option
Step 3 - Select the "From 1" option
Feel free to start with 0 or a custom range. In the end, as long as the index numbers are unique, that is all that is needed to tie them back to the Sales Type ID in the Sales table.
Here is how the table should look after adding the index column.

Next, rename the index column to Sales Type ID. You'll notice the instructions on the image suggests this is optional. You can certainly leave it to the default name. However, when Power BI tries to establish a relationship with two table in its repository, when a field has the same name in both tables, it will likely make the connection.

Now it's time to merge the Sales Type values into the Sales table. This is done using the following steps:

Be careful not to select the Merge Queries As New. The solution given in this tutorial is only for the Merge Queries. It's possible to make the other option work, I just haven't tried it, though.
Before merging, make sure you have the Sales query selected, not the Sales (2). If you have the Sales (2) table selected, the process will try to merge from Sales to Sales (2).
The Merge options will ask for another query for the merge. Choose Sales (2).
Next, Select the Type column for both queries, and not the Sales Type ID in the Sales (2) column. The columns must contain matches or it won't merge anything. The section at the bottom of the merge screen will indicate how many rows are a match. You won't always achieve a 100% match like this example.

After the merge, you'll need to guide Power BI on how to handle the imported data. Click on the option shown below:

Choose the defaults for this example. Feel free to experiment with the other options on your own:

The category text for Sales Types now resides in the Sales Type table. We no longer need to carry this data in the Sales table. We only need the Sales Type ID. Power BI will set the relationship accordingly.
Select the two Sales Type text columns and delete them as follows:

The merge process adds a lot of unnecessary information into the headers of the columns in merges. Let's simplify this name to Sales Type ID. Doing this will allow Power BI to establish the relationship automatically (Assuming that the name is the same in the Sales Types table).

When complete, the column should appear as follows:

Like before, rename the Sales (2) table to Sales Types:

Don't forget to hit the Close & Apply button. If you close the window without doing this, you'll lose all the additions/changes you made.

If you followed the steps above and named everything as specified, when you click on the Relationships tab (red arrow in image), all the relationships should have been established automatically.
Power BI does this when it recognizes the same names for columns between tables.

You can arrange tables easily by dragging and dropping them. This isn't necessary, but is helpful. It allows you to see all the tables and how they are related to each other.

What to Do If the Relationships Are Not Connected by Power BI
In most cases, if you name the columns that will be used to match the tables, Power BI will do its best to set up the relationships for you. If you find a few relationships that are not connect, you can drag the column from one table to the one you want to match. Drop it onto the column that you want to use to establish the relationship.
The names of these columns don't have to be the same. For instance. if you had one table that contained a CustomerID and another table that contained a ClientID, and you knew they reference the same entity, you can match them together by dragging one to the other.
It's important to have these tables connected. Otherwise, you won't be able to use them to create the reports or dashboards properly. You'll have to use several workarounds to make it work. Trust me when I say that is not worth the effort. When you establish the proper relationships, your modeling efforts will be much smoother.

