- You are here:
- Home »
- Business Intelligence
Category Archives for Business Intelligence
Mastering USERELATIONSHIP() in DAX: A Deep, Practical, and Engaging Guide
How to unlock alternate relationships and take full control of your data model’s behavior Power BI’s data model is built on relationships—those invisible highways that let filters flow from one table to another. Most of the time, the model’s active relationship does exactly what you need. But real-world data is messy, multi‑dimensional, and full of […]
Continue readingWhy DAX Exists: Measures as Templates and Windows as Context
Do you struggle with DAX? If so, you’re not alone. The hardest part with DAX isn’t the syntax. It’s conceptualizing it mentally. What does “filter context” really mean? Why does a measure give different results in different visuals? When people first encounter DAX, they often ask: “Why do we need a whole new formula language? […]
Continue readingThe Four Core DAX Measures

When I first started working with Power BI, I often heard that you could get by with just four core DAX measures: Total Sales, Total Cost, Total Profit, and Profit Margin. At the time, that advice felt empowering—keep it simple and you’ll cover most reporting needs. But as I gained experience, I realized that framing is […]
Continue readingCreate Lookup Tables from Fact Tables Using Merge in Power BI

When analyzing data, analysts should adhere to best practices. Once such best practice is to use a star schema for the data. At its basic level, a star schema contains one or more fact tables, and several lookup tables. But data often doesn’t come to the analyst as a star schema, which means the analyst […]
Continue readingTutorial: A Quick and Easy Mapping Table in Power BI

I often work with annual reports, including financial statements for listed companies. I do it both for investing and for my job where I want to know the financial solvency of my clients and potential clients. One sore point with financial statements is the lack of standardization of the line items. If I want to compare […]
Continue readingCreate Lookup Tables from Fact Tables in Power BI

At some point, you’ll need to create lookup tables from data sources. Excel users often clump all entities together in each row. This is a natural way for them to view the data and it’s the easiest for them to enter it this way. You’ll likely find customer names and addresses, product names, prices and […]
Continue readingReview: Power BI – Up & Running with Power BI Desktop

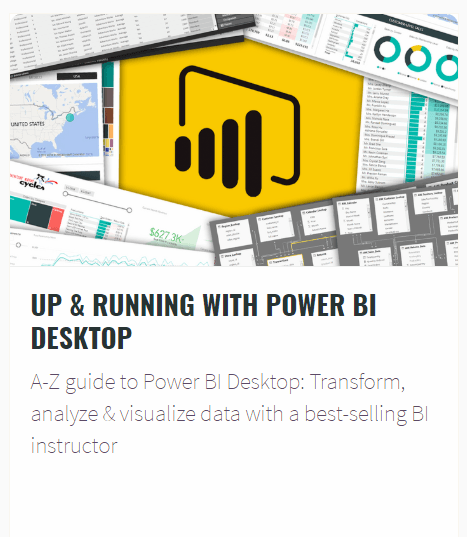
Course: Power BI – Up & Running with Power BI DesktopInstructor: Chris DuttonPlatform: Udemy.comPrice: VariesRating: 5 Stars (out of 5)SummaryIf you are struggling to learn the intricacies of the Microsoft product, Power BI, then you owe it to yourself to take this course on the topic. Chris Dutton does such an amazing job teaching it. […]
Continue readingIntroduction to Power BI – Training that Helps You Learn Quickly

Power BI is an analytics program that helps people gain insights into data. It’s not overly difficult to learn, but it has several powerful features that can make it overwhelming for newcomers. There is great training online for the software, but I happen to find one called Introduction to Power BI. It is training that […]
Continue readingHow to Get Started with Power BI

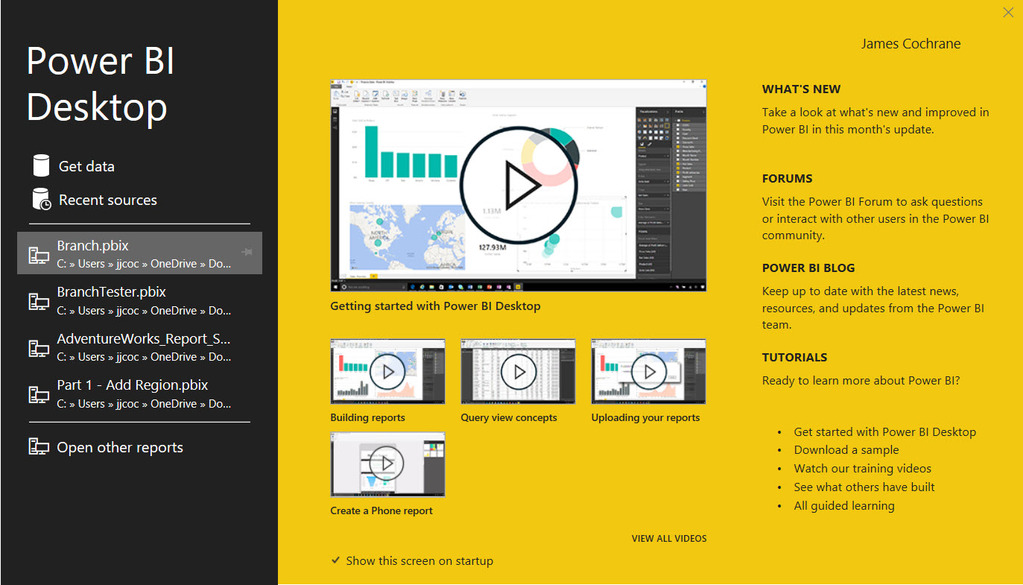
Power BI is an analysis tool created by Microsoft. It is part of a class of software tools known as self-service business intelligence tools, which means that it is supposed to be easier than most analytics-based tools. However, it still has a learning curve that users need to master. This tutorial will help you get […]
Continue readingLoading R Scripts Into Power BI

R is a popular language for data science, although recently Python is winning the language wars. Still, R has its proponents (yours truly) and will continue in its use throughout the data science community. Did you know that it can be used with Power BI, too? This quick tutorial gives instructions on loading R scripts […]
Continue reading