What if you could at a glance, look at a report about your business and know exactly how it's doing? What if you needed more information about a segment of your business and you just click on the line item to drill down into details about it?
If you are like most people, you're probably thinking that you need high-end software to do this type of analysis. Or, you need to be an Excel expert and fiddle with the likes of pivot tables and other such concepts. There was a time when you would be right with your assessment.
However, the gracious folks at Microsoft decided to bless us with a gift and that gift, my friends, is Power BI!
I'll get into why you should learn Power BI. But, first, I want to describe quickly how I came across using the software.
As part of my journey into learning data science, I started using Tableau software. This package allows you to create visualizations easily by dragging and dropping components of a data set and adding easily-created metrics. The software makes creating these visualizations a breeze.
For playing around with mock data sets, Tableau was a great package. However, I knew that eventually I would want to use it in a professional capacity. That's when my heart sank. Tableau's free version doesn't allow you to save your work locally. You can only save to their server.
That restriction might be okay if it wasn't for the fact that my data sets were available to all other members of the Tableau community. In other words, they are all public.
Tableau does have a paid version. But, seeing as I am not ready for industrial use yet, I hesitate to start paying a monthly fee for the use of the software. It's not overly expensive, but why pay for something you aren't using in a professional capacity, at least not yet?
Another problem I had is what happens when I get so enthralled with the features of Tableau that I have no choice but to upgrade? I didn't want that to happen. I didn't want to be a slave to a software package.
Looking for Alternatives
To make a long story short, I evaluated several packages and finally determined that Microsoft's Power BI is a good alternative.
This isn't a full coverage of the product. It's just a quick overview to explain why I am becoming a fan. I do have plans on creating short tutorials to show you the capabilities of the software.
You may want to learn Power BI as for one thing, it's free. There is a pro version, but so far, I haven't found any reason why I would need it. It seems the pro version is geared towards team use and has other publishing advantages. I'm not there yet!
My Initial Thoughts on Power BI
Honestly, I didn't think much about the software when I downloaded and started playing with it. When I looked through the interface, it didn't seem like the software was capable of doing much. Then, I read a few books and viewed a few tutorials. I committed to learning the software and have stayed on track, which I am happy about.

Through my learning of the software, I discovered how good the package is. It has a lot of features that can help you create great visualizations. I am not an expert in either Tableau or Power BI to claim one being better than the other. I'll save that for another post in the future!
Is Power BI Difficult to Learn?
The software is relatively easy to learn. However, there is a learning curve. I wish I could state that you could master the software in an afternoon, but you won't. However, I don't believe it's going to take you months to learn. You just need to commit some time with good training material.
Probably the biggest factor in getting up to speed is learning about a concept known as filter context. This is what puts the power in Power BI. It's like the force on Star Wars. You get the idea. It's pretty powerful stuff!
But, filter context takes a bit of practice to grasp the concept. When you hit a road block with Power BI, chances are good that it has to do with filter context. Don't worry, though. If you are willing to push through and keep at the tool, you'll get it before you know it!
Data Sources
Unlike Tableau, Power BI gives you many data sources you can connect to, or at least, it has more than most businesses and people need. There are plenty types of data sources available and as you get proficient, you can even create your own. I haven't done this yet, so I can't speak to it. But, it's on my list of things to do!
The software treats each table the same whether they are loaded from a text file or from a large-scale database. Once it's loaded into Power BI, the software doesn't know the difference between a database table and a text file. All data sources become an entity of the software.
The takeaway from this is you won't have to worry about converting from one entity to another inside the software. You can establish relationships or create calculated columns, among several other features that make your job easier.
Data Transformations
This aspect of the software really shines. You will be amazed at how powerful it is to split data or convert it from one type to another. You can merge columns and append rows. You can also add new columns using criteria from existing columns. There conditional columns and extractions.
It's difficult to describe all of the transformations that you can use in Power BI. However, you'll be happy to learn that they are easy and intuitive to use. Once you get the hang of one type, you can handle most of them.
Quick Example
To show how easy it is to create a report, I created (in Power BI) a table that contains sales for each of four regions. This data is fictitious and could represent regions of a country, regions of a community, or regions of the world. Your choice!
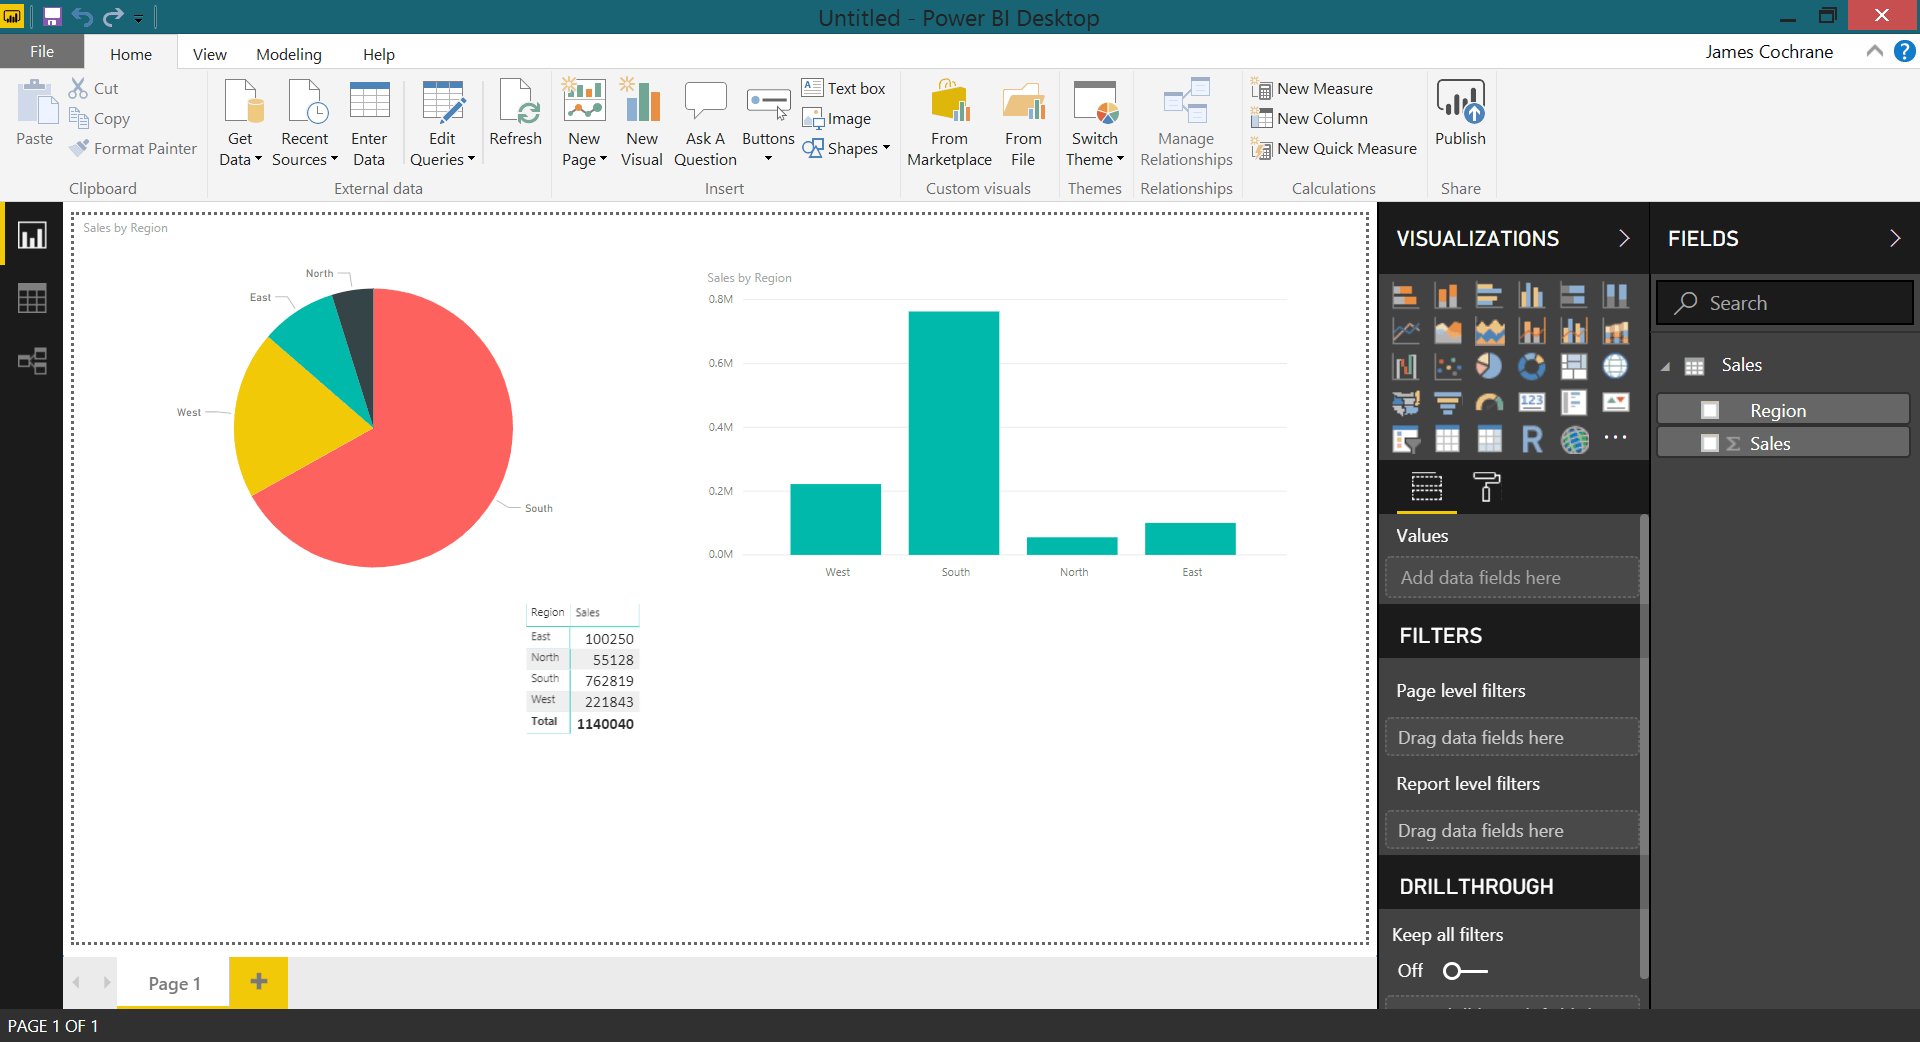
It took me all of about three minutes to create the report above (including creating the table and populating the data). Is this something you could do in Excel? Sure. But, creating reports that are much more sophisticated is almost as easy in Power BI once you learn what you need to learn. And, all components of the reports (called Visuals) are interactive and each Visual will change with a click on another Visual. This goes back to that concept of filter context once again!
Managing Table Relationships
This could be the feature that loses some people. You will need to have an understanding of relational database modeling. You don't need to know any advanced concepts to get started, but you will need the basics.
Power BI tries to establish relationships for you. It does an okay job, but you'll probably need to redefine a few of them, to say the least.
Without this feature, you won't be able to make the software work when you have multiple tables that you need to use. When you only have one table, you won't have to worry about this constraint. However, you also won't use the software the way it was designed. This means, you will likely have to create a bunch of workarounds to get the type of reports you were hoping for. It's just easier to learn the basics of relationships among tables. Once you learn, you can use this skill forever with Power BI.
To get a feel for how powerful the relationship concept is in Power BI, I created two tables, a Sales table and a Product Category table. The sales table contains the information about each sale including the product category ID, the customer ID, the quantity, and the sales amount. Since initially, there is no relationship to the ProductCategory table, Power BI has no way to tie the two together.
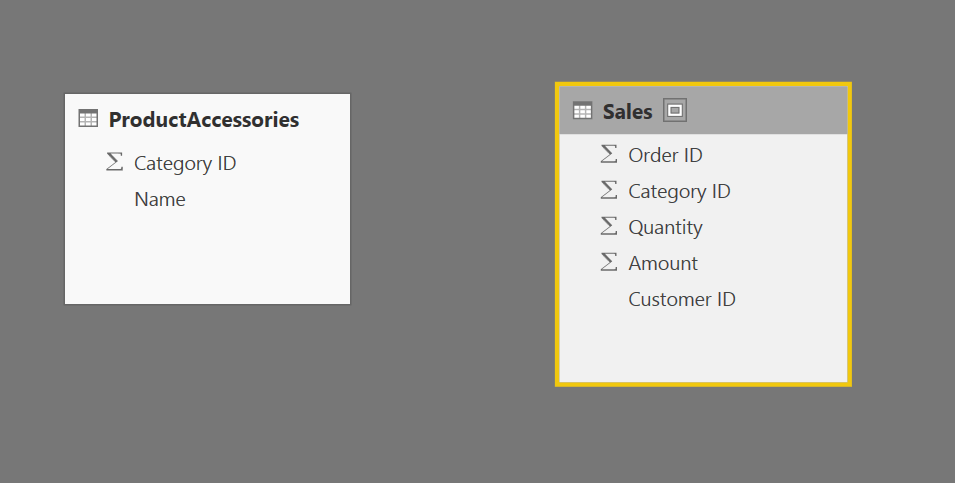
As you can see from the following Visual, when I try to tie the ProductCategory name to the Sales table, Power BI has no way to know how to do that. Therefore, it simply returns the sum of all the values in the sales table and associates that single amount ($535.00 below) with each category, including categories that have no sales.
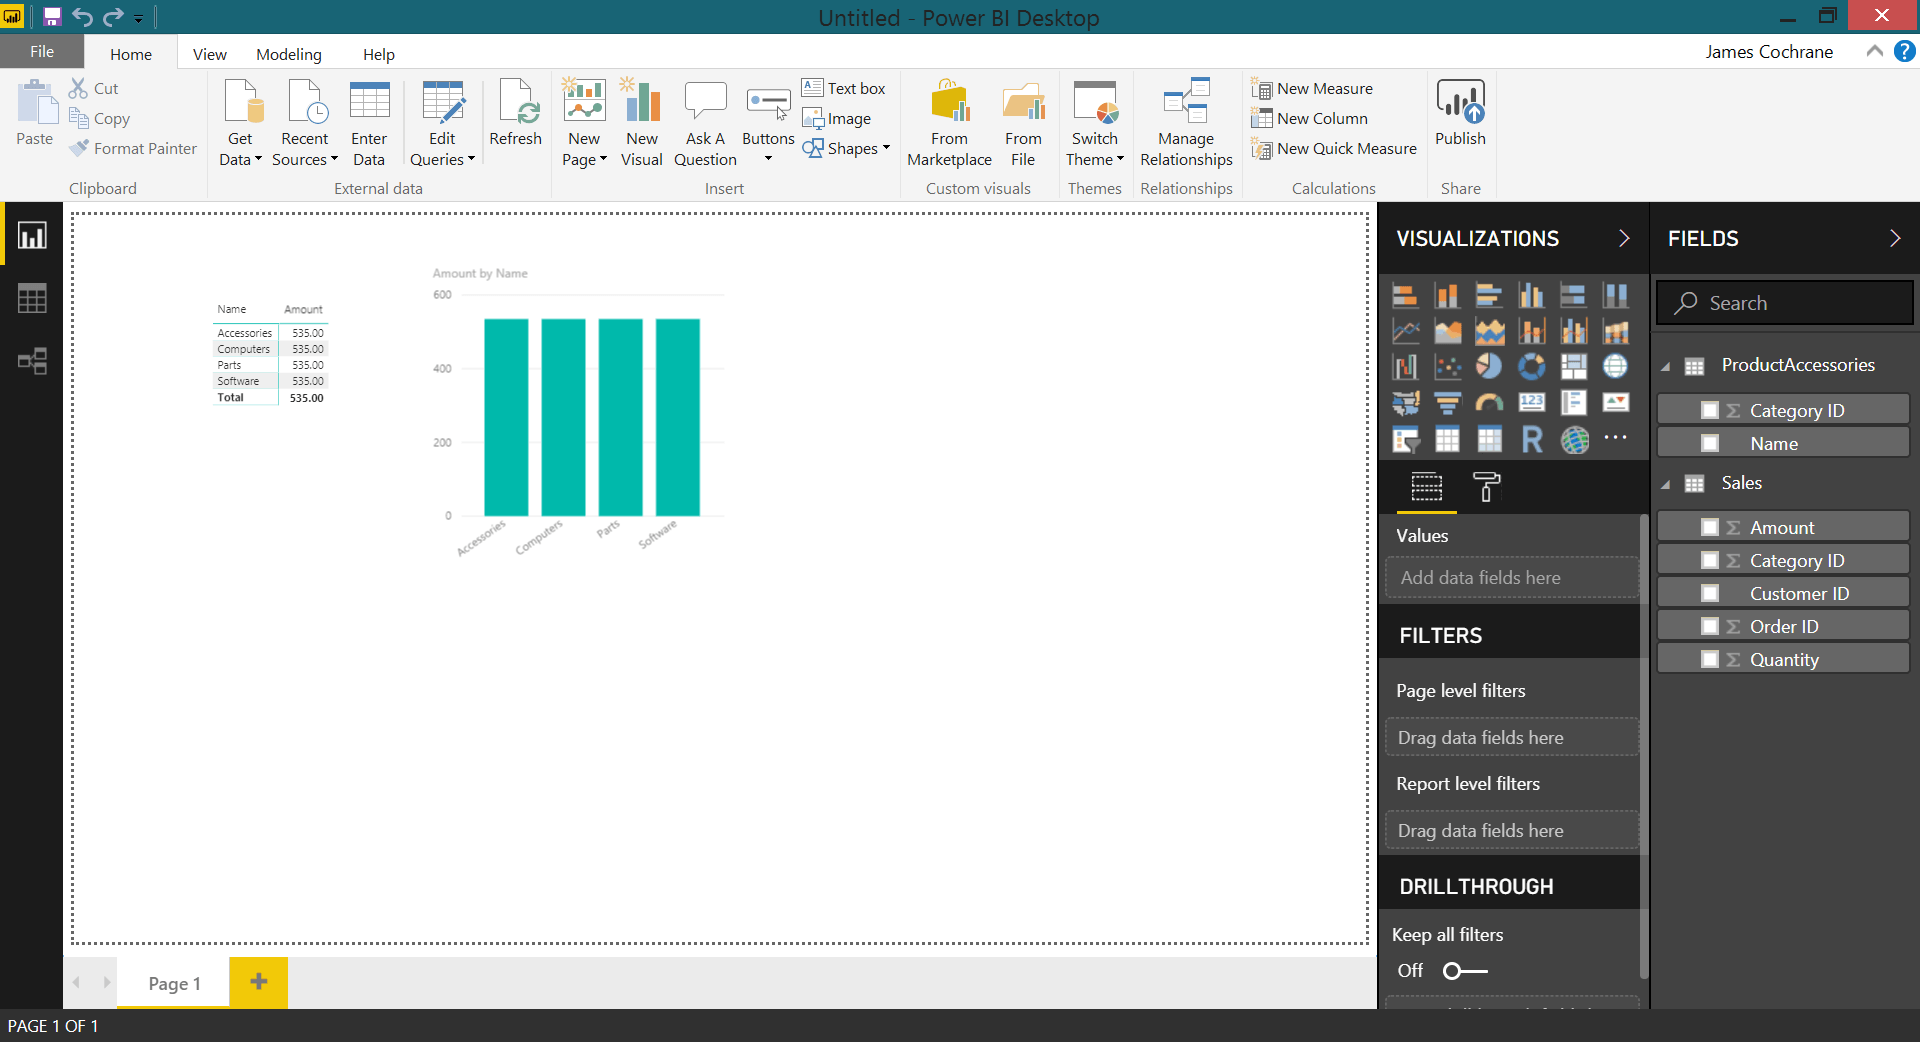
The takeaway here is you wouldn't be able to know how many sales per category were made from these visuals. Obviously, this is not very useful.
Once I establish a relationship between the two tables (via Category ID), the scenario changes.
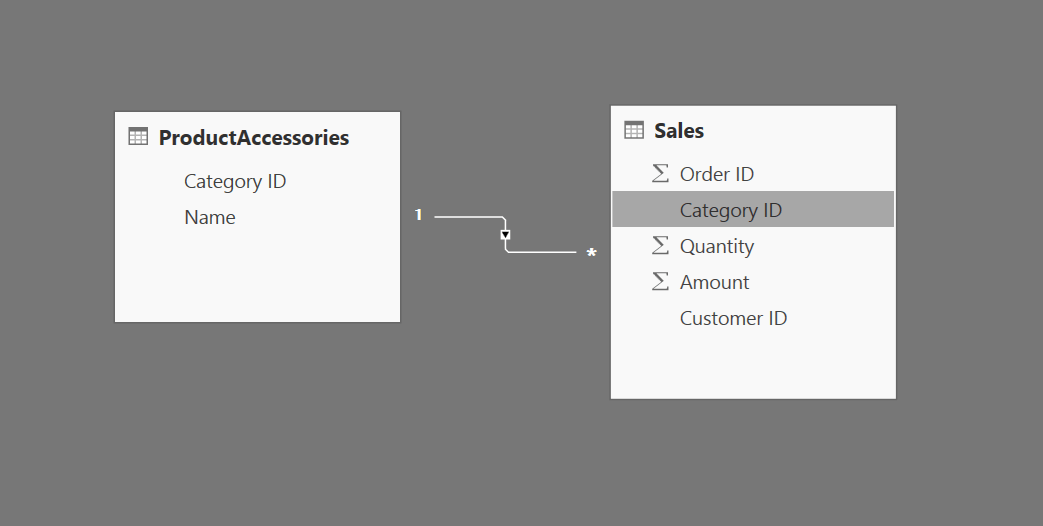
It only shows product categories from sales that were actually made, and the amounts that are displayed are correct. Since only products from the Accessories and Computers category were purchased, those are the only two displayed with those correct amounts.
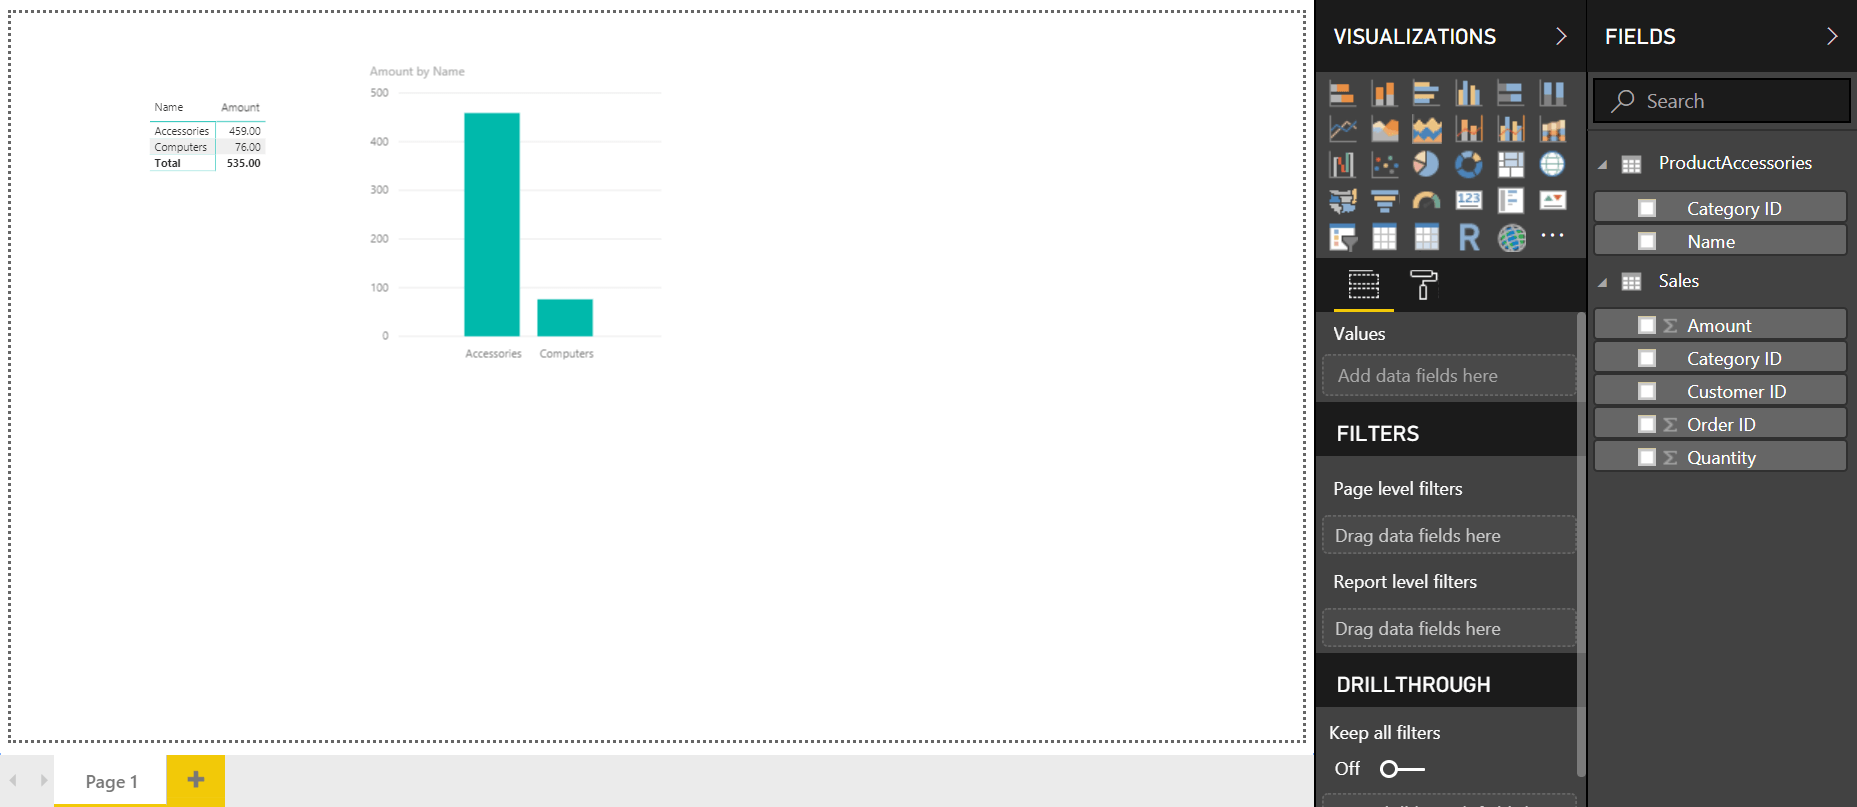
This is exactly what we want and can answer proper questions based on the data.
You can guess that this is an oversimplification, and it is. But, when you extend this concept with more tables and ones that are larger in size, the concepts remain the same. Therefore, this is a good starting point to see how powerful this concept truly is.
In many programming languages, you would need to establish these relationships yourself by creating complex joins on the tables. Plus, you'd have to manage the display of the visuals which is definitely not anywhere near as easy as using Power BI.
Conclusion
If you are looking to for insight from your data (or other people's data), you owe it to yourself to give Power BI a try. It's a flexible and powerful software package that is free. You'll need to go through the learning curve, but for many that will be a period of weeks, not months. This all depends on your tenacity in using and learning the software.
