Power BI is a robust business intelligence tool, hence the BI in its title, that allows analysts to create meaningful reports from an organization’s data. You can think of Power BI as a next generation of Excel and once you learn the functionality, you’re going to be amazed at the tool’s capabilities. But what often trips up beginners is the whole concept of dynamic modelling. To understand that you’ll need to comprehend what’s the big deal about filter context in Power BI.

A dynamic model changes based on the inputs of the report. The changes are made by the user of the reports, which is why Power BI falls under the category of self-service business intelligence, or self-service BI.
After setting up a report, the business user can click on various elements of the report and the report changes to reflect what was clicked by the user. For instance, if you have a report that is tracking total sales, the amount displayed in the Total Sales will be dependent upon the filters that are defined in the report. Filters are nothing more than fields that can be manipulated in some way to dynamically change the report.
You can probably see where this is going regarding filter context. Context, from a Power BI standpoint, is the environment for which the filters modify the data that is displayed in the report. This may seem confusing right now, especially for those who are not familiar with the concept.
However, that is the purpose of this tutorial: to clarify what is meant by filter context and why it is a crucial concept to master.
The goal of this tutorial is to help you learn the basic principles of filter context without too many complications. The amount of data we’ll use for examples will be tiny. This by design.
I find that too many people attempt to learn these concepts with large data sets. They spend an inordinate amount of time trying to tie out the numbers. And you’ll need to tie out the numbers to understand the principles. These learners use data sets with too many rows and columns and too many tables. It hinders their ability to learn.
I have adopted a much simpler approach of three tables, Sales, Customers, and Products. The Sales table contains 18 sales records, with five customers and four products.
The Sales table doesn’t contain multiple customers or multiple purchase per customer. It’s one customer per day. The days are spread out over records for about one and a half years.
This approach does not model real-world scenarios, but it is simple enough to explain the concepts of filter context. And that is the point!
I won’t be covering too much of the DAX language in this tutorial. The DAX language is the internal language for the data model. You will eventually need to learn DAX to do any significant analysis in Power BI. But you cannot learn DAX without a solid understanding of filter context.
Let’s get started.
Prerequisites
This tutorial assumes you have a basic knowledge of Power BI and you are familiar with created measures. You should also have an understanding of data modeling in Power BI.
Related: How to Get Started with Power BI
You’ll need a working copy of Power BI desktop. Please download from the resources at the end of this tutorial.
Related: Useful downloads for this tutorial.
Overview
In this short tutorial, you start with a measure (Total Sales) already created for you. The data will be loaded, and the relationships will be properly set. You will then create three separate visual tables that will use the [Total Sales] measure to view total sales by:
- Customer
- Product
- Category
The spreadsheet for the data contains tabs for the Sales, Customers, and Products. The Products table also contains the Categories. Here are the tables:
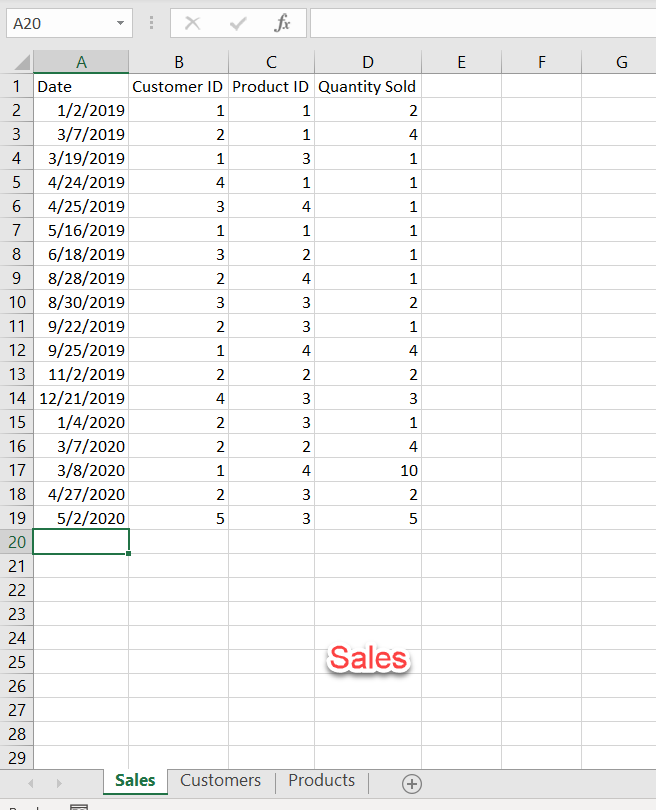
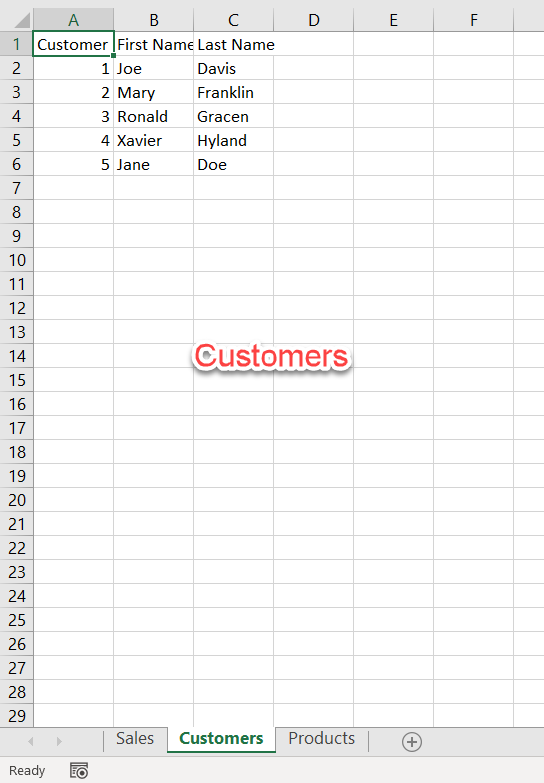
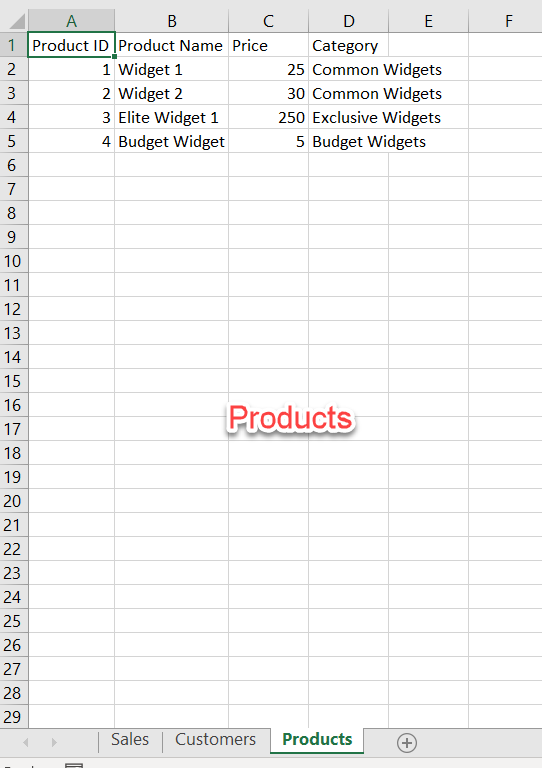
The measure that we’ll be using is Total Sales and is defined as:

If that is difficult to see, here is the definition in larger print:
Total Sales = SUMX(sales, Sales[Quantity Sold] * RELATED(Products[Price])
You don’t have to worry about how this statement works for this tutorial. Just know that it takes the number of products sold from the Sales table and multiples it by the Price of each product for each row and the sums up all the rows.
To see how you would manually do this yourself with the underlying data (in Excel), go to the Tables tab in Power BI and extract the Sales table to a CSV file:
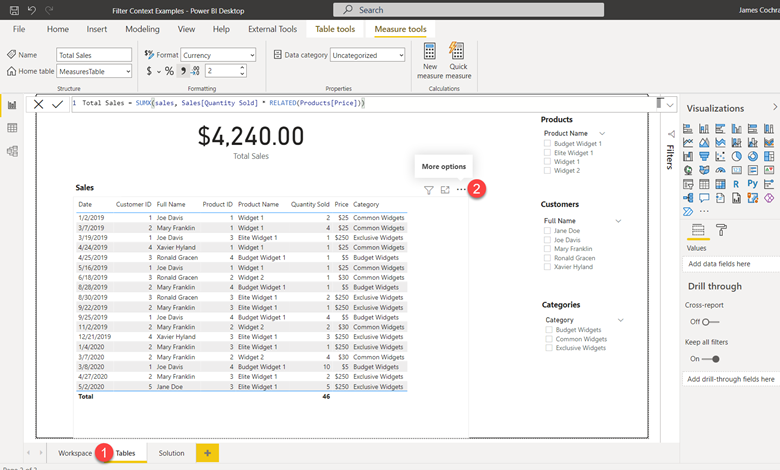
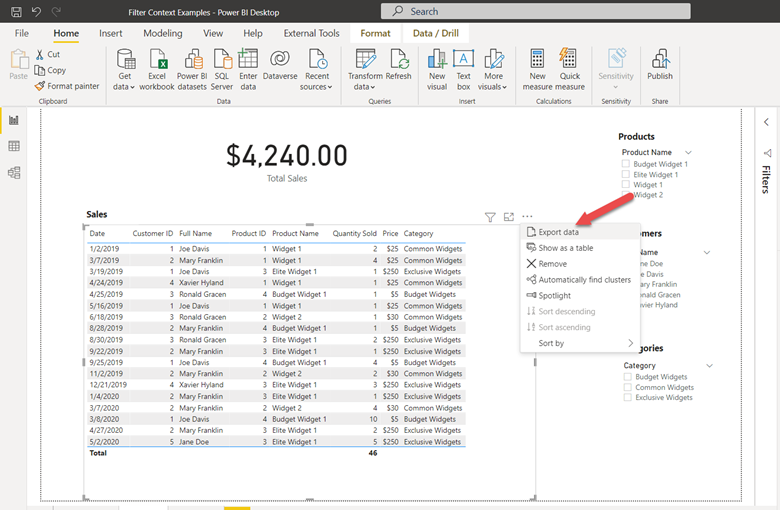
Then, open the file in Excel. For each line item, multiply the Quantity Sold by the Price. Then, sum up all the results. The amount should match the Total Sales of $4,240.00:
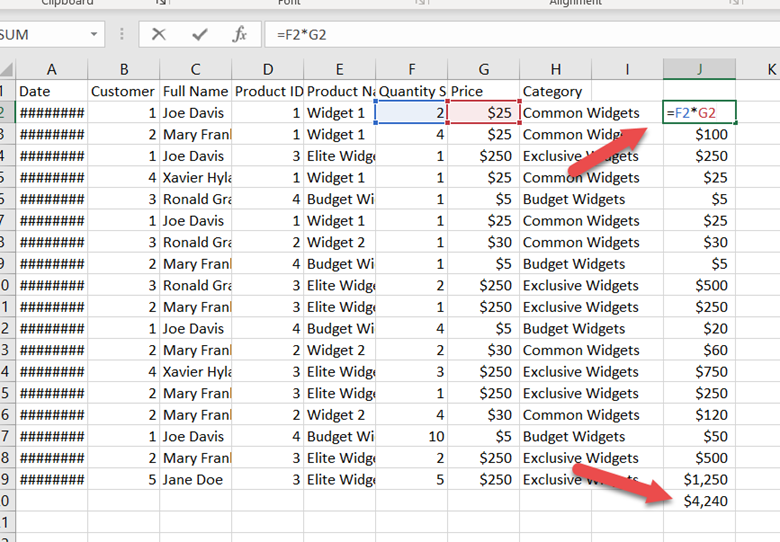
NOTE: It is so important to know how to tie out the numbers when working with filter context and DAX expressions! I urge you to go through this exercise to solidify your understanding of how the numbers are derived.
Question: Just based on this exercise (and looking at the spreadsheet results), does the Total Sales of $4,240 make sense to you?
Conceptually, it should make sense, right? We asked Power BI to multiply each Quantity Sold by the Price of each product. Then we took the sum of those results. It makes total sense that the number matches $4,240.
For the next part of this exercise, click on the Workspace tab.
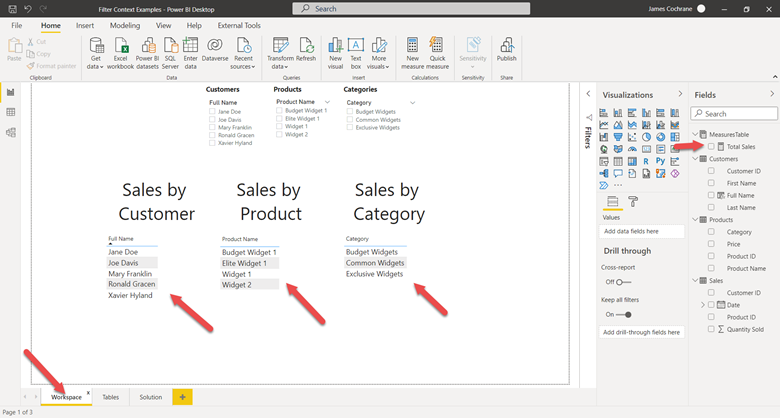
Then, drag the Total Sales measure into each of the tables (Sales by Customer, Sales by Product, and Sales by Category). When complete, it should look like the Solution tab:
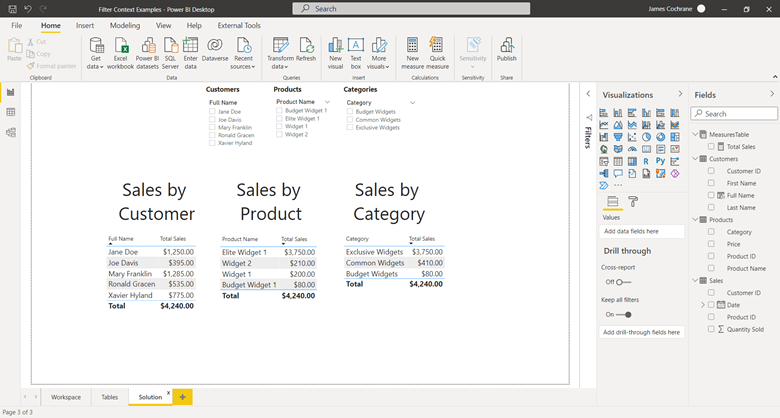
If you have difficulty with dragging the Total Sales, simply use the Solution table for the rest of this tutorial. However, it’s good practice to try and get it to match!
Observe the results of each of the three tables. Here is a fundamental question and answering it is crucial to your understanding of filter context (that is also a hint):
How does Power BI know to take the total sales by customer for each of the customers? The total sales by product for each product? And the total sales by category for each category?
We never defined the Total Sales to use any tables at all!
How can this be?
As you might have guessed, it all has to do with filter context. Measures use filter context. And yes, they are not defined for any given table. That is the power of a tool like Power BI. You can create measure like Total Sales and use it in any report or visual. Power BI will use the filters defined to determine what value to display for total sales.
To drive this point home, try filtering on Customers, Products, and Categories. You can use the slicers at the top of the screen to accomplish this. For instance, what happens when you check the checkbox for Joe Davis?
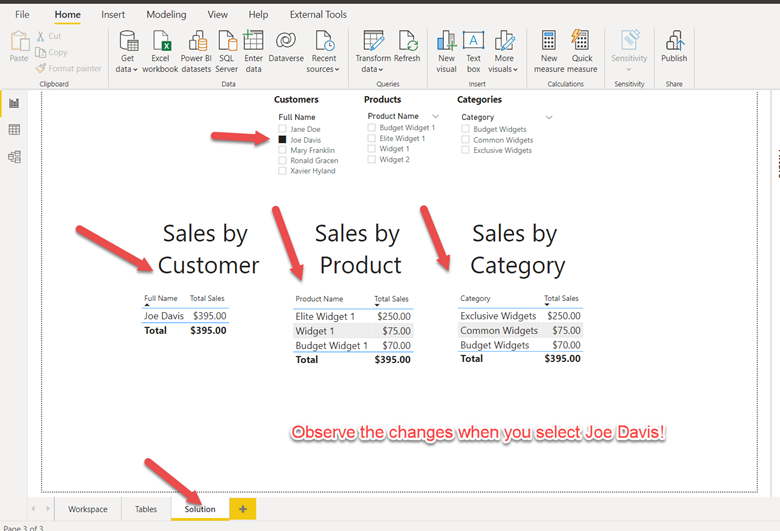
Question: How do you derive the $395 totals that are displaying for each of the three visual tables?
Consider this: the second visual shows that Joe Davis bought an Elite Widget 1, a Widget 1 and a Budget Widget 1. Now take a look at the Products table, which shows the prices of each product:
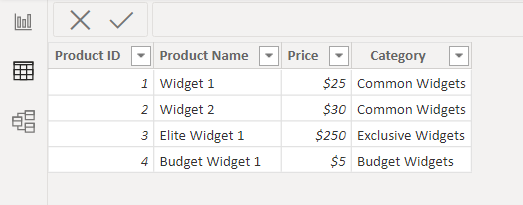
The Elite Widget 1 does indeed cost $250. But the Widget 1 costs $25 and the Budget Widget 1 costs $5. If you add up $250 + $25 + 5, the result $280. Where does the $395 amount come from?
To answer that question, use the Tables tab and select Joe Davis in the Customers slider:
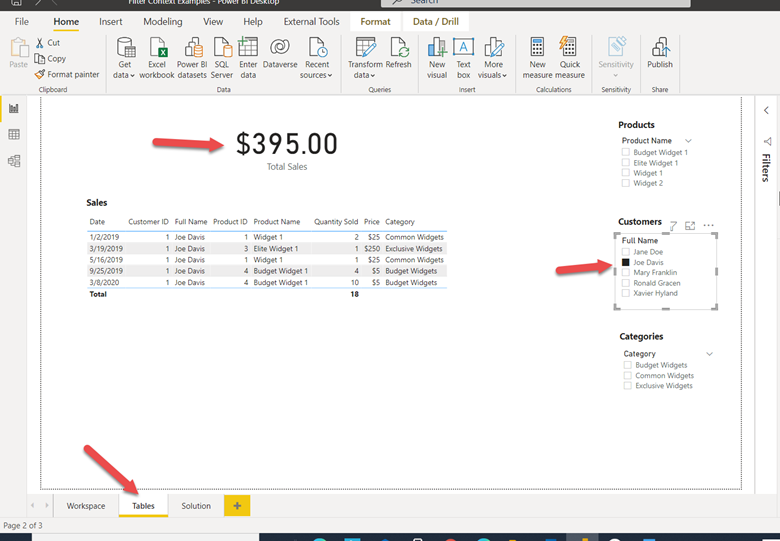
As you can see, Joe Davis bought 3 total Widget 1 products (3 x $25 = $75) and bought 14 Budget Widgets 1 products (14 x $5 = $70). $250 + $75 + $70 is indeed $395.
Back in the Solution tab (or your Workspace tab if you got it working), the Sales by Product visual matches these amounts:
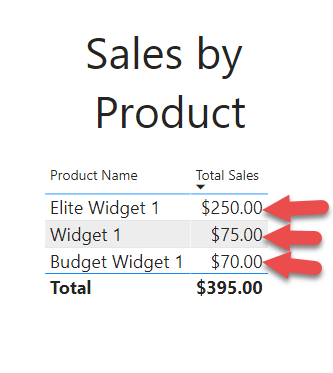
Question: Why don’t the visual tables (Sales by Customer, Sales by Product, and Sales by Category) show the full details of the transactions (including the quantity sold and prices)?
Answer: we didn’t ask Power BI to do that. We only included the Customer Name for the Sales by Customer, the Product Name for the Sales by Product and the Category Name for the Sales by Category.
Had you included the date column in any of the Sales by tables, you would see the granular-level data for each of the groupings.
In Power BI, you will get exactly what you asked for, even if it is not what you intended on. That’s why the steps of going through these exercises of tying out the numbers are essential.
Extra Credit (Non-Beginners only!)
If you are familiar with using Power BI and creating models, why not try to reproduce this entire exercise yourself without guidance? The steps are as follows:
- Create a blank Power BI file.
- Use the Get Data to load the Widget Sales.xlsx file. Select all the tables when asked. In the Customers table, add a column that concatenates the First Name and Last Name. Call it Full Name.
NOTE: the tables should be clean so no transformations will be necessary. But double check to make sure. - Ensure that the relationships are correct. IMPORTANT! Or the exercise won’t work!
- Create a measure for Total Sales (as defined previously). I stored this in a MeasuresTable that I defined from a Blank Query option. But remember – you can place measures anywhere.
- Create three sliders and label (using Textboxes) them Customers, Products, and Categories, respectively.
- Add the Full Name of the Customer table to the first slider.
- Add the Product Name of the Products table to the second slider.
- Add the Category of the Products table to the third slider.
- Add three visual Tables. Use Textboxes to label them Sales by Customer, Sales by Product, and Sales by Category.
- For the first visual table, add the Full Name from the Customers table and the Total Sales measure.
- For the second visual table, add the Product Name from the Products table and the Total Sales measure.
- For the third visual table, add the Category from the Products table and the Total Sales measure.
If you get stuck, feel free to refer to the solution.
Conclusion
This tutorial gives you a brief introduction into filter context. It by no means extensive, but it is a good start. By playing around with the various filters and tying out the numbers that are produced as a result of those filters, you’ll start to gain a solid grip on how filters (and filter context) work in Power BI. Then, when you’re ready to tackle DAX, you’ll be ahead of the game!
Resources
The following resources can help you with this tutorial. Some of them are basic tutorials in Power BI to get you ready for this tutorial. Others are links to the files needed for the tutorial.
Disclosure: purchases made from some of the links may result in commissions generated for the site owner.
