- You are here:
- Home »
- Artificial Intelligence »
- Using AI to Explain Economic Data: Building a FRED Dashboard with AI Commentary
Using AI to Explain Economic Data: Building a FRED Dashboard with AI Commentary
Economic data is everywhere. Investors have come to expect monthly reports on inflation, unemployment, GDP growth, and consumer spending. When some reports hit the financial news, markets react violently, with some up and some down. Investors sometimes expect movement from other indicators, yet the stocks hardly budge. The average person is often at a loss to understand why these situations happen.
NOTE: All code for this is in the resources section of the page.
The problem is not a lack of data. The St. Louis Federal Reserve’s FRED database offers free access to hundreds of thousands of economic time series, including the Consumer Price Index (CPI, a measure of average change in consumer prices), housing starts (the number of new residential construction projects), and the federal funds rate (the interest rate at which banks lend reserves to each other overnight).
The data is organized and available, but raw numbers and trend lines mean little unless you know how to read them. What does it mean when the yield curve inverts (when long-term interest rates fall below short-term rates, often seen as a recession signal)? Is a 0.3% month-over-month rise in core CPI (which excludes food and energy prices) concerning, or is it normal? When unemployment rises by a tenth of a percentage point, does it signal recession or just statistical noise?
Motivation for Using AI for my Financial Data Feed
I had wanted to write a program that pulls data from the FRED’s API. As a writer for my blog, FinancialMarketsEducation.com, I needed relevant material, and FRED data certainly checks that box.
I researched how the API worked and experimented with several indicators. After about the twelfth time asking ChatGPT what a particular indicator meant, it hit me that I could just have the Python program ask any frontier LLM. They all have APIs at this point. An API is an abbreviation for Application Programming Interface, a standardized method for accessing data from services (online, but not always).

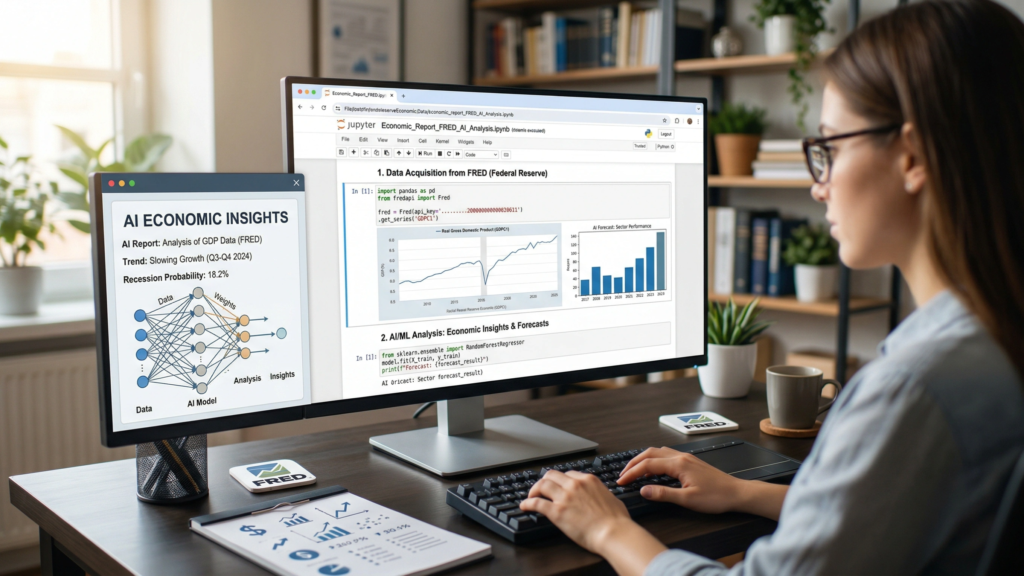
I decided to code this in a Jupyter Notebook because it supports graphics, markdown, and code. It’s also fairly easy to enter your AI’s API key. For this implementation, the program uses OpenAI’s GPT-4o model exclusively to generate plain-language, real-time commentary on each indicator. It is a simple idea with the potential to significantly inform anyone who wants to stay up to date on the economy without a degree in economics.
How the Dashboard Works
The FRED Economic Dashboard takes a different approach. It automates the entire pipeline, rather than waiting for someone to write an article interpreting the latest data. The notebook connects to the FRED API, fetches the latest data for key economic indicators, and generates clear visualizations with matplotlib. Then, it sends each chart’s underlying data to GPT-4o using a prompt requesting concise, accessible commentary.
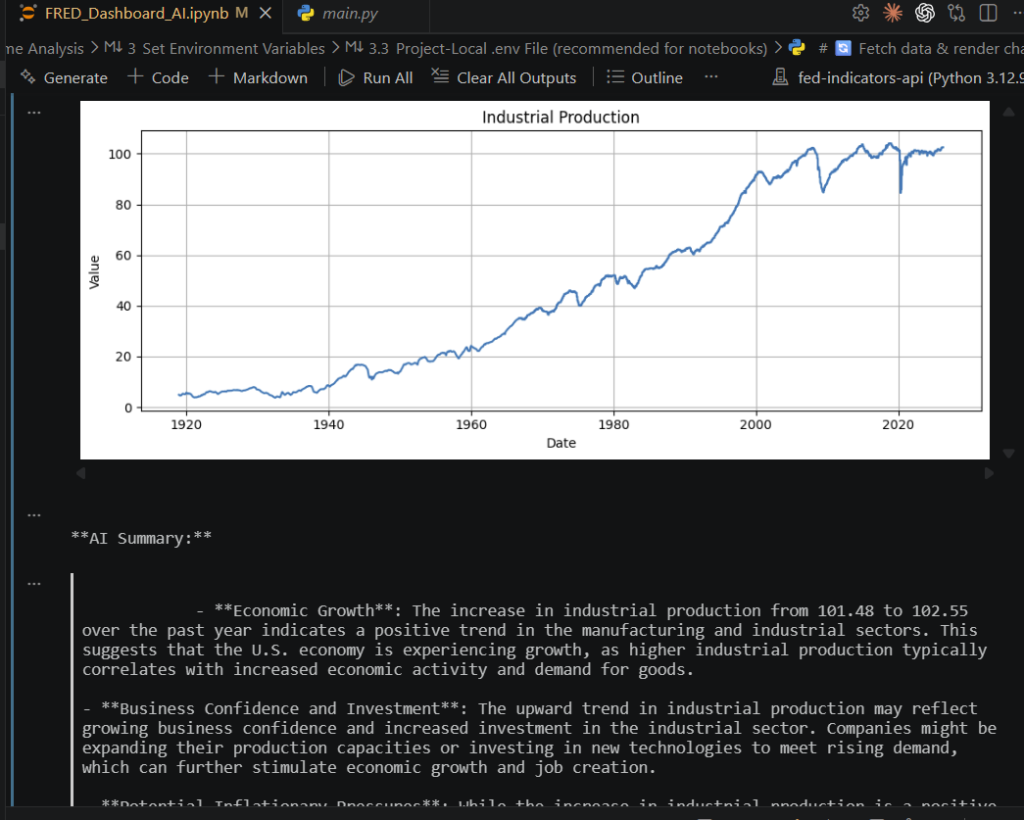
The result is a set of current charts, each paired with a concise AI-generated analysis that explains the data, its significance, and emerging trends. The commentary uses plain language for readers unfamiliar with the M2 money supply or the PCE deflator.
Setting it up is simple. You need two API keys: one from FRED and one from OpenAI. At the moment, the FRED API is free to use. The cost of the OpenAI API will depend on which models you choose and how much you use this program. Most of the indicators selected for the program, as written, are monthly indicators. So there isn’t a reason to run it that frequently, which means the costs of the OpenAI API should be negligible. However, it is always worth watching and keeping tabs on.
You’ll also need a handful of Python libraries. The project supports environment variables, .env files, and standard terminal configuration. It integrates with most existing workflows fairly seamlessly. Once configured, running the notebook produces a fresh set of charts and commentary in seconds.
Why This Matters for Everyday Readers
The real value isn’t the technology, but its accessibility. With basic Python skills, anyone can instantly generate a personalized, AI-powered economic briefing. No paywall. No journalist delays. No need to parse dense Federal Reserve minutes to understand the central bank’s perspective.
This is especially useful for several groups. Small business owners get a quick read on economic trends without the cost of costly research services. Individual investors see data and analysis side by side before deciding. Economics or finance students use the dashboard as a tool, comparing AI analysis with their own understanding and building intuition over time.
It also helps address a subtle problem: the gap between what data says and what people think. Economic indicators are often misinterpreted, sometimes deliberately, in political and media discourse. A tool that provides a neutral, data-driven reading provides users with a baseline for comparison with other narratives.
Limitations and Responsible Use
No tool is perfect; this one has key caveats. GPT-4o is a language model, not an economist. Its commentary relies on patterns in training data and received numbers. It lacks institutional expertise and real-time market insight. Sometimes, confident analysis misses crucial context, such as one-off policy changes or unrevised data.
Treat AI commentary as a starting point, not advice or a final word. Compare with other sources, review Federal Reserve statements, and consult professionals for major financial decisions.
A Step Toward Financial Literacy
At its core, this project is encouraging. It’s a step toward understanding factors that matter to investors’ portfolios. The data has always been public. Visualization tools have existed for years. But the missing piece was the interpretive layer, which can turn a chart into a usable story.
By combining FRED’s data with modern AI, this dashboard makes the economy easier to understand. While it won’t replace professional analysis, it gives millions a practical way to grasp the factors shaping their finances.
Resources
The full source can be found on GitHub: techhound/Econ-FRED-AI.
About the Author James
James is a data science writer who has several years' experience in writing and technology. He helps others who are trying to break into the technology field like data science. If this is something you've been trying to do, you've come to the right place. You'll find resources to help you accomplish this.
