Power BI is a wonderful product released by Microsoft. It gives business owners the ability to create high-level reports and analysis for measuring how the business is doing. But, to optimize the software, you need to make your data definitions for Power BI work correctly.
Why Establish Data Relationships?
If you are just getting started with a tool like Power BI, you'll probably start by importing worksheets from a spreadsheet. Then, you'll attempt to create reports from those worksheets. This is when all hell will break loose. You will curse at the software and wonder how the heck I (or anyone else) can declare that Power BI is great software. You won't be able to make it do what you were hoping for.

The main reason is likely to be that you haven't established the right data relationships. Let's explore this further by way of an example.

This example is obviously contrived for the purposes of this discussion. However, a business owner may produce something similar.
This is a sales or orders table that shows orders by customers for certain products. It's further broken out by region.
From the look of this spreadsheet, it's easy to deduce what it's about. Most people who are familiar with working with spreadsheets could have come up with the same explanation. That is what makes this format attractive. It's easy to understand.
But, when you analyze the structure further, you'll recognize flaws with it. First, the customer name can easily be misspelled. In the example, did the data entry person (business owner?) mean to write Mary Cantrary or Mary Contrary? It seems as though it was meant to be the same customer. But, there's no way of knowing without asking.
The last line seems like it is for a different product (Widget10), but the Price per Unit and Cost per Unit are both the same price as Widget1. It seems odd (although not impossible) that these two products would have the same price. It could be another data entry error.
You can also see that the price for Widget1 is entered as $59 for the third order. Was this a discount applied or a mistake in data entry?
The above problems are the ones that are obvious. Where it gets less obvious is when you apply the format to a tool like Power BI.
Suppose instead of five records, there were 100,000. Further, suppose you wanted to break out the sales by region or sales by customer. You would need to filter through the customer column and hope and pray that there are not other mistakes. If there are, they will skew the results. Plus, having large descriptions repeated will slow the software down.
An Alternative Format
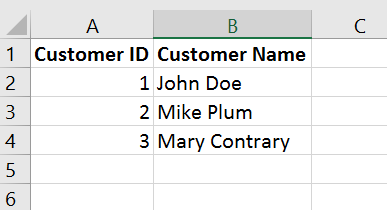
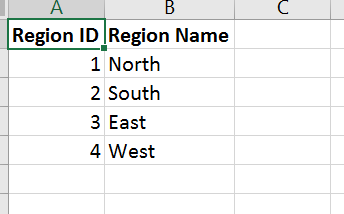
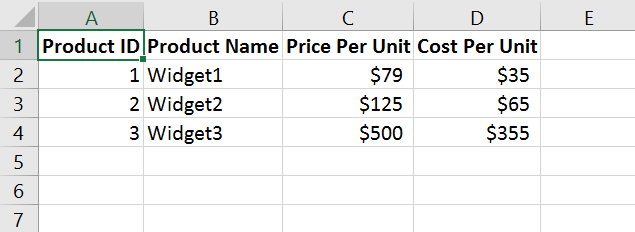
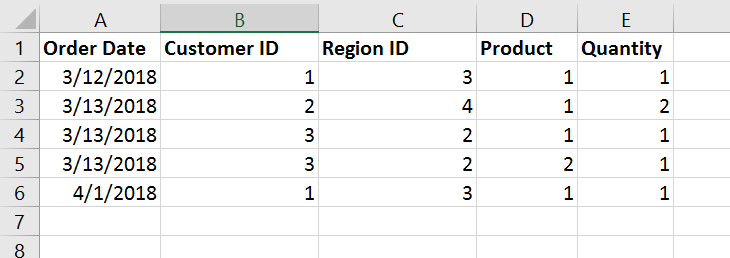
You can separate the certain information into their own worksheets. For instance, you can create a worksheet named Customer and put all the customers in there. You then assign it arbitrary identifiers for each row. In the sales table, you simply reference this unique identifier. You can do the same for Regions, and Products.
The following is the new formats for our example.
The Customer Worksheet:

The Region Worksheet:

The Product Worksheet:

The Modified Orders (Sales) table:

This design helps to refine our model and reduce the errors that may occur. It's also much faster from a lookup perspective. If you have thousands of rows in the orders table, going through numbers will be much faster than going through the respective text.
Another benefit we get is that we removed two columns from the Orders table (Price per Unit, Cost per Unit). These both were moved to the Products worksheet.
Will Business Owners Adopt This New Format?
I can hear you thinking that your users won't adopt this method. It is certainly not easy for them to manually look up each dimension (Customers, Regions, Products) each time they enter in a new field. Good luck in trying to convince them of doing it this way.
If the client is using a database system such as MySQL, SQL Server, or to some degree Microsoft Access, the structure of the data may already be in the correct format.
If the client enters most of the data in a Microsoft Excel spreadsheet, then it will likely contain several redundant columns as I have already shown. Even if you could convince your client to break up the spreadsheet into dimensions that support the data entry, it still would require transformation on the Power BI end.
This is because your client isn't going to manually lookup id's for each customer or product or region, etc., each time he or she enters in a sales or order record. Even if the client used VLOOKUPs or HLOOKUPs, they still would not contain the numeric ID you would need for Power BI to have its optimal structure.
Transformations to the Rescue!

Luckily, Power BI has the capability of performing seriously powerful transformations. These transformation can take a large, redundant spreadsheet table and create the necessary dimension tables. You need only create these once, and when the Refresh button is hit by the client, any new records that have been added will have the transformations applied.
It's beyond the scope of this article to go into the specifics of these transformations. But, it is on my to-do list to provide a tutorial on the dynamics of this technique. You'll be amazed at how simple, yet powerful, this will be.
The takeaway is you may not need to have your client do much of anything when it comes to entering data via spreadsheets. In most cases, they can continue entering the way they have been and you still can get the data in the format that Power BI needs.
Caveat: All this assumes the client will continue to enter data in the current format. For instance, if he or she decides to switch columns or add new ones, that could break the transformations going forward.
Naming the Columns in the Power BI Transformations
When you set up your transformations, you're going to create new columns. These id columns will likely be named 'index'. If you leave the default column names, you are almost guaranteed to spell out trouble when Power BI tries to autodetect the relationships of the tables.

It makes sense, if you think about it. Suppose you create a customer table using the transformations and in the process create an index column. You leave the index column name as the default. Then, you create a product table and leave the index column with the default name, too. When Power BI tries to detect what relationships exist, it will use the two index column names and try to join them together.
Technically, customer and product tables don't have much in common. But, your indexes will be numeric starting from the number 1. That means the first customer will have index = 1 and the first product will have index = 1. Power BI will assume a relationship here and couple Customer.Index = 1 to Product.Index = 1.
Then, it will try to figure out how to tie both of them into the sales or orders table. As you can see, this is a train wreck waiting to happen.
A better approach is to name the columns with their appropriate IDs and make sure those names carry over to the sales/orders tables.
When you transform your Customer table, you may be tempted to call the identifier as "ID". Don't do this. Instead, call it "Customer ID". Make sure that when the Sales/Order table pulls that ID in it's called 'Customer ID' as well. For products, use 'Product ID'. For regions, use 'Region ID', and so on.
When you do this, you are almost guaranteed to have Power BI set up the relationships exactly as you need them. This will require little intervention on your part. You'll still need to check to make sure they were set up right. But, it won't take long to do this when it is set up correctly.
Summary
Power BI is a great tool to help you and your clients learn more about what is going on in your business (or your clients' businesses). It can give you the insights into how well the businesses are doing. It does require the proper set up of table structures which can be performed relatively easy with the tools provided by the software.

Once these transformations are in place, they will continue to work when new orders/records are added, assuming the structure remains the same.
Finally, make sure you use the right identifiers for your column names. This helps Power BI detect the proper relationships between the tables, which means less work for you which frees up your time. That is something everyone needs a bit more of these days!

