Let's face it. Looking at data sometimes can be a nightmare. It never seems to conform to the neatly laid out samples from training modules. Often, the data you obtain is a scattered mess. How do you make sense of it all? This article will help learn how to get familiar with your data.

Why is Data "Dirty"?
You'll probably hear data being described as dirty. It's easy to guess what this means, but the term describes data that is not in a format useful for analysis. There are many reasons for this, but one overarching reason is because many people who work with data are not familiar with proper data formats. They are given a task and a tool (usually a spreadsheet) and asked to analyze the data.

I am not trying to knock these people. They often do a great job given the constraints of the tools and the lack of knowledge about how to properly structure their data. Also, Excel is rather open-ended, which is by design.
In many cases, formatting spreadsheets for proper data analysis is not the right path to choose. Often, this would require strict data entry protocols using macros and other techniques. This process would no doubt slow down the entry for spreadsheet users.
What to Do Instead
Instead of having spreadsheet users enter data in a favorable analytics format, many BI tools are equipped with Edit, Transform, and Load (ETL) tools. These tools have become sophisticated enough to handle many of the transformations given by the data. So it makes sense to let spreadsheet users do what they've been doing so as not to slow down their business processes.

ETL tools are great but if you aren't familiar with your data, it won't do you much good. Before you transform data you need to understand its structure. Otherwise, you could be transforming incorrect fields which will lead to the faulty analysis. Garbage in, garbage out!
Common Themes within Data

I am concentrating on spreadsheets for this article, but data does come in many formats. However, a lot of company data and rules are contained within spreadsheets. You probably have a few in your organization that you work with, either generated by you or coworkers.
Some data formats, like high-end databases, are likely to be in proper their proper formats as the database forces certain rules when created the structures of the databases and tables. However, just because those rules exist, doesn't mean there aren't people in organizations who lack an understanding of how to apply those rules.
Sometimes, these poor, unfortunate souls are placed in a position of becoming the DBA just because no one else was available or willing to take on the role.
It doesn't matter what format your data is in. You'll notice some common themes. We'll continue referring to spreadsheets, but if you use other formats, you should know that the principles of data familiarization are similar across the board.
Look for Repeating Values

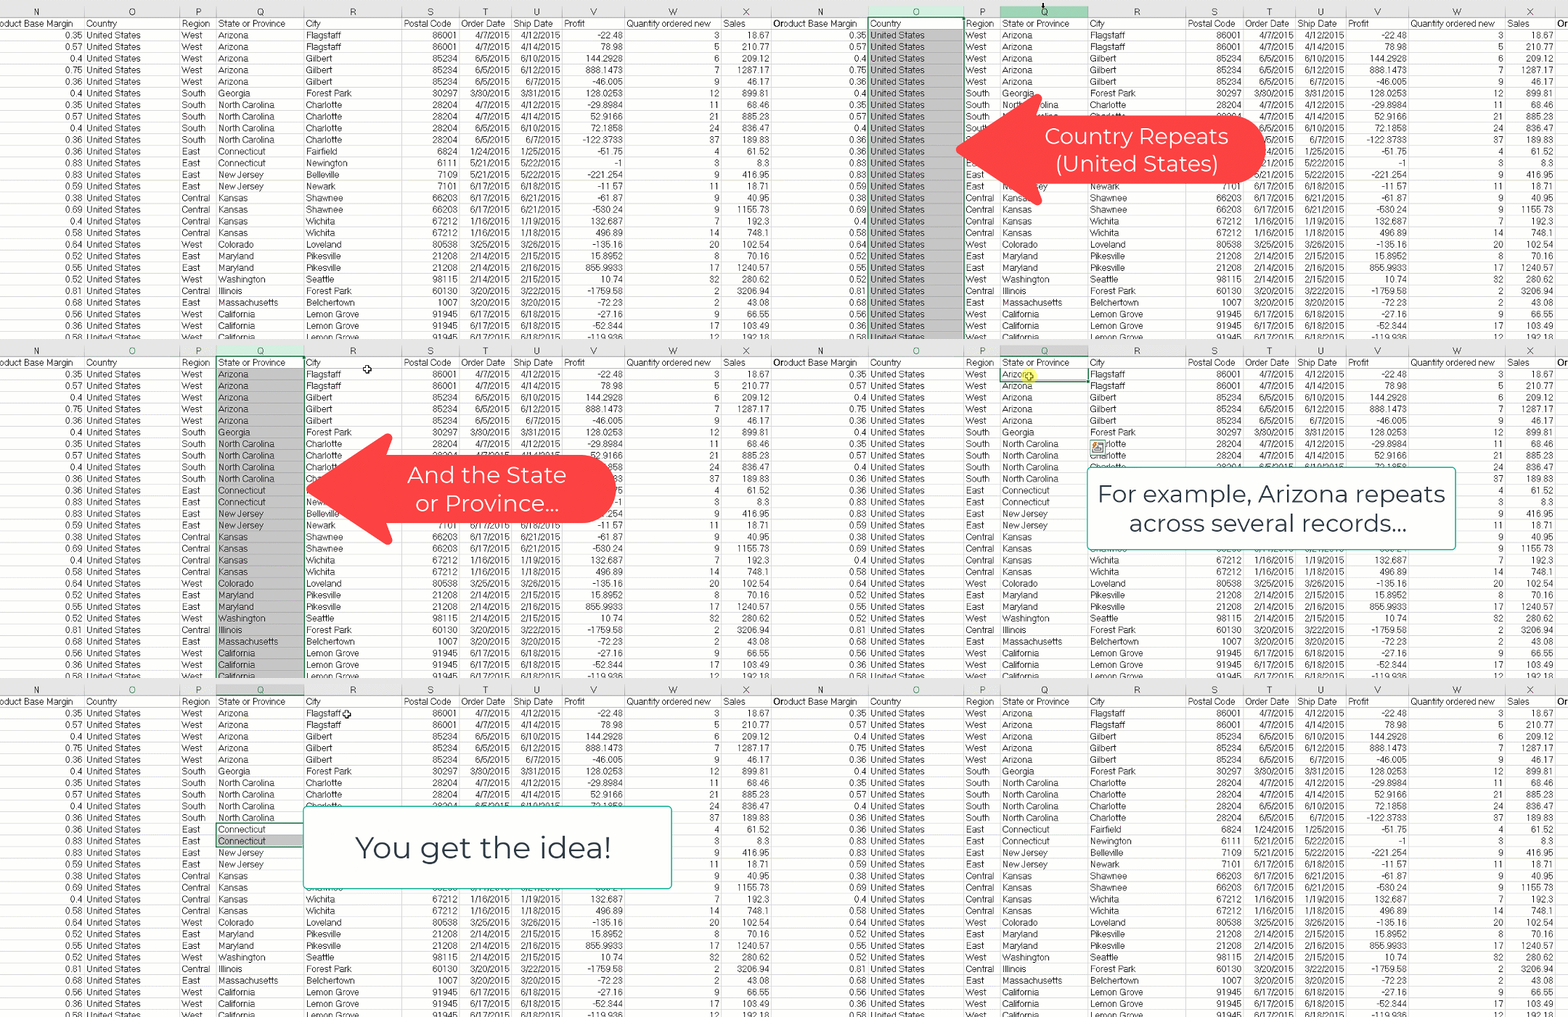
When looking at your data, the first item to look for is data that repeats. Take the sales system in the animated gif, for instance. You can see that there are repeating values in the Country, Region, State or Province, City,, Postal Code and others.
What you should also consider is what happens if one of the repeating values is spelled wrong? For instance, in the above graphic, what if one of the Arizona instances were spelled as Arizons? The letter "s" is close the to letter "a" on the keyboard. It's conceivable that this situation could occur. Your data analysis or BI tool will treat this as a separate record.
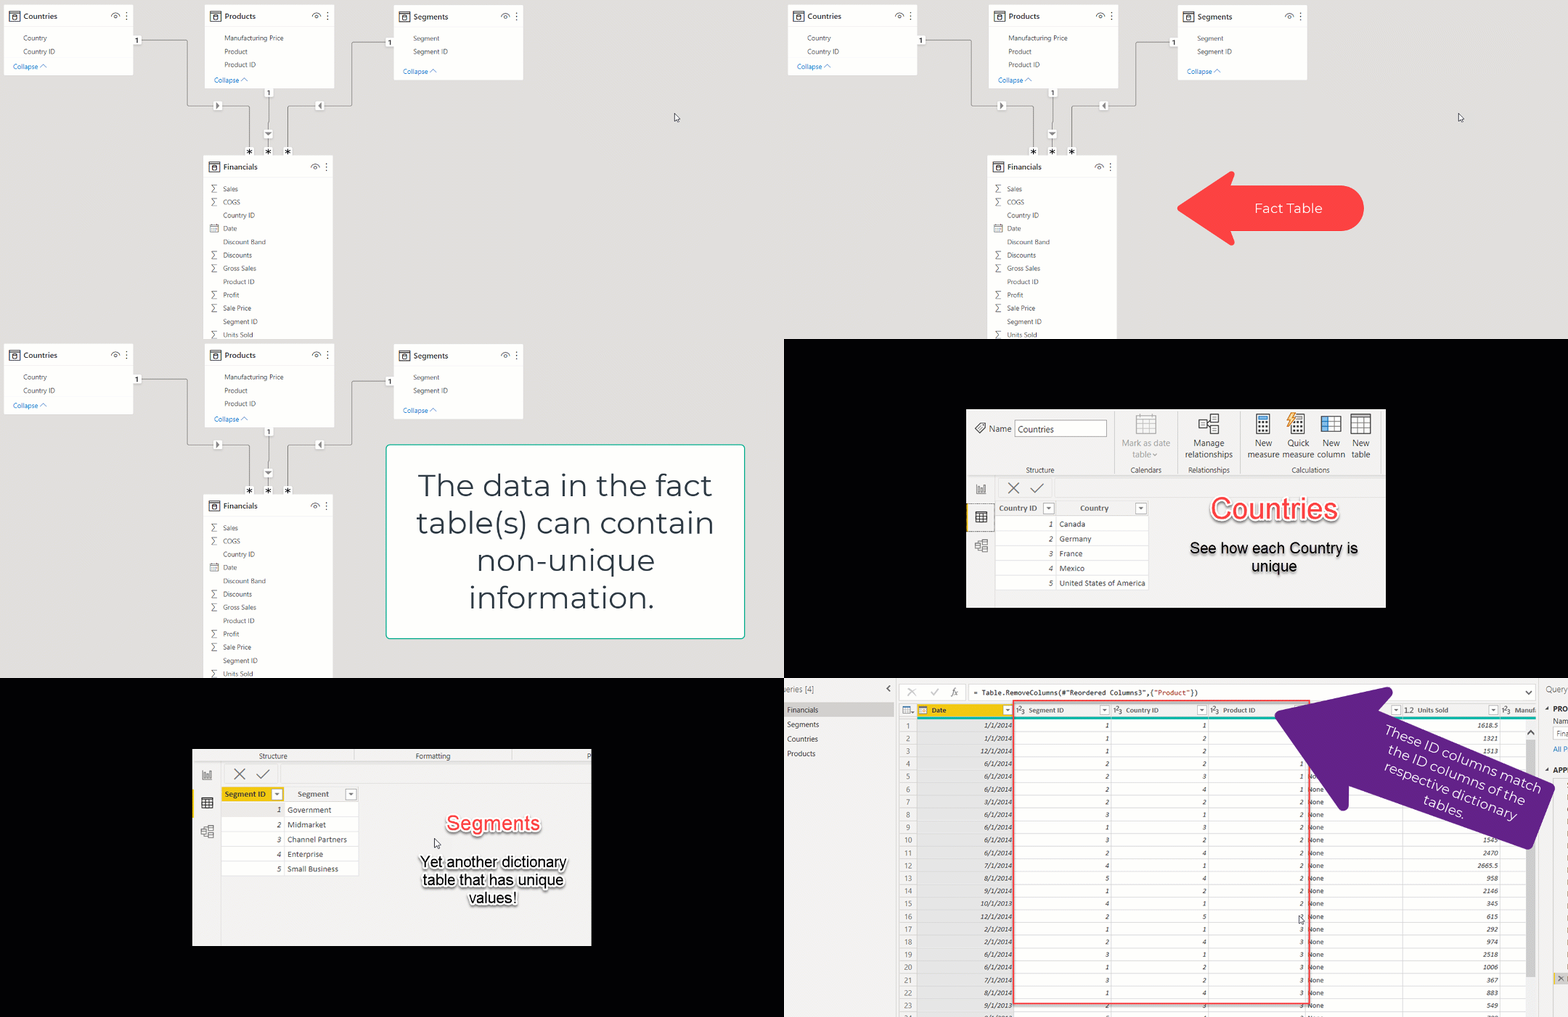
The remedy for this situation is to use an ETL tool to create a lookup table (or dictionary) table from the columns above. In the above example, the Countries would be extracted to its own table, assigned a unique ID to each country and then that unique ID would replace the Country column in the main table.
By the way, transforming the process to a separate country dictionary table won't initially stop the misspelling problem. That is something that you'll either need to handle in the ETL process (if possible) or determine that a problem exists by looking at the new Country dictionary table. Since there will be fewer records in the dictionary table, it will be easier to notice the problem.
The main table (Sales), which is often called a fact table, can have thousands, and even millions, of records. Dictionary tables usually have much less than that.
Look for Uniqueness

Note: the data used for the example in this section was derived from a sample taken from Microsoft's website.
Take a look at the animated graphic above this text. It shows three dictionary tables (Customers, Products, Segments). Each of these dictionary tables have unique values. The fact table, on the other hand, contains IDs for each of the dictionary tables. Values for these IDs are often not unique in the fact tables.
The Financials fact table above, contains several non-unique values that serve as a pointer into the dictionary tables.
Remember: Dictionary tables are often referred to as lookup tables.
The fact tables usually contain information that answers the questions for your analysis. In the above example, the Financial table contains the Date of the transaction, the Segment ID, Country ID, Product ID for the lookup tables, the number of units sold, and the sales amount. These fact tables often contain other information that is associated (per line item) with the transactions.
Although some fact tables can contain hundreds of columns, analysts should seriously consider trimming down the number of columns as they can impact the performance of the model.
Check for Differences that Should be the Same
As stated, the data you work with won't usually be in the format of fact table and supporting lookup (dictionary) tables. This is ideal for analysis but not so much for data entry. What this means is spreadsheet users are likely to enter in data with misspellings or a lack of consistent capitalization.
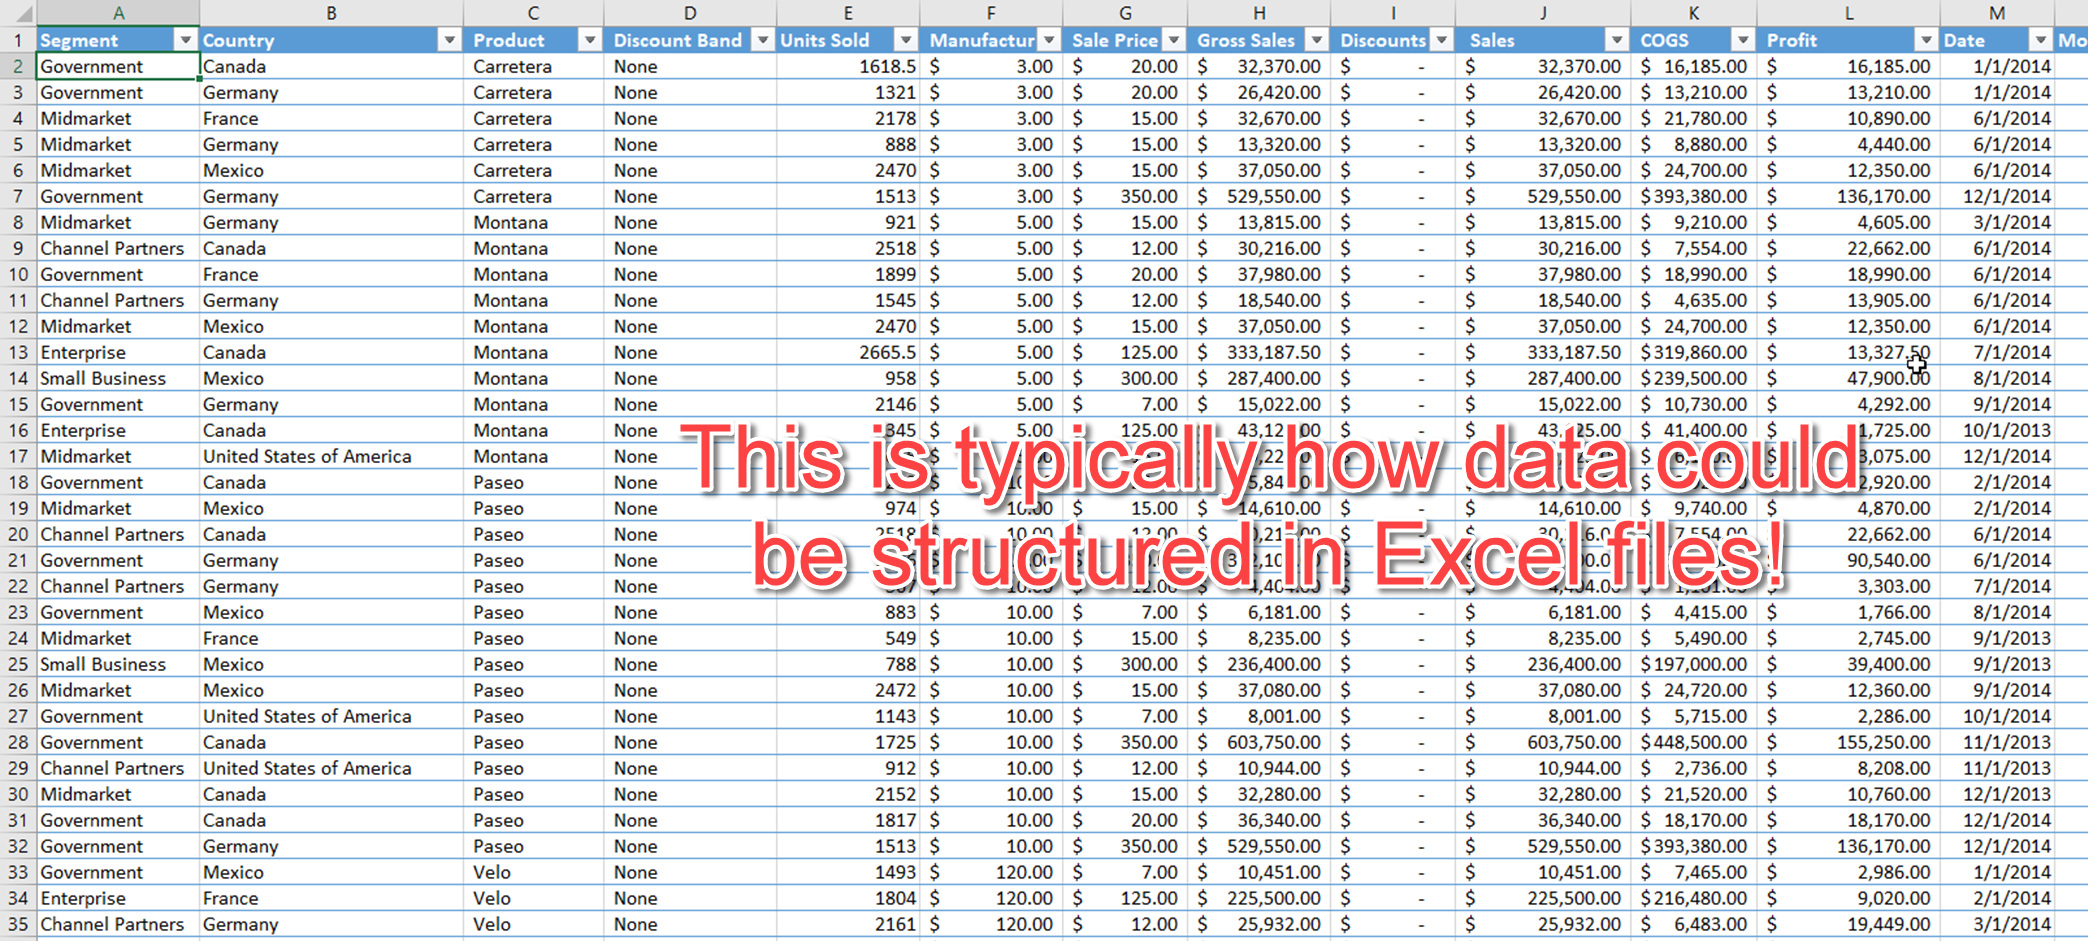
The following is typically what a data file in Excel would look like:

NOTE: This data is the same source before it was transformed (using Power BI) from Microsoft.
Excel has gotten sophisticated over the years and has a feature that auto fills fields that you have entered previously. So the occurrence of the differences on fields that should be the same is likely to be less than it used to be. However, it still happens and analysts need to account for it.
ETL tools should be capable of handling these issues. However, sometimes this situation can be tricky to solve and may require advanced techniques from programming tools like Python or Java. If there aren't too many instances, it may be worth simply having the data owner make the changes in the original data source.
A Word About Data Types
BI tools are often savvy enough to convert data into its proper formats. These tools pick up on dates, numeric fields, and even booleans (true/false). They get it right often, but they sometimes get it wrong. You should never depend fully on the capabilities of the tool. Make sure you check the data before and after transformation.
Sometimes, it is worth converting certain fields from one type to another, even if the BI tool correctly assesses the type. For instance, it's rare that anyone would use United States Zip Codes for any numerical processing. But BI tools often keep or convert this field into a numeric.
When the BI tool gets a hold of it, the Zip Code is often aggregated (summed, averaged, etc.) That makes no sense. But making this field into a Text type, this situation will never occur.
You also need to consider how items will be sorted when used in analysis. For instance, you can create month names from your dates using BI tools. But if you use the month names as a column and expect it to be sorted by month, it will sort instead alphabetically. That means April will appear as the first month, followed by August, etc.
Don't Forget About NULL Values and Blanks
When BI tools convert data, you'll notice that they sometimes don't convert numeric fields properly. When they don't get it right, they tend to make the fields into Text. Sometimes, this problem can occur due to blanks or NULL values.
You may think that the BI tool should simply make these fields into zeroes. But that is often not the correct course of action to take. There may be reasons why these fields are blank or NULL, and knowing this is important. If you simply fill in these fields with zeroes, you'll mask the problem.
There are instances when blanks or NULL values should be turned into zeroes. But that should be up to the analyst, not the BI tools. The BI tool can be set up to handle the conversion if that is the course of action to take.
Other reasons why conversion don't happen is that data fields contain information other than blanks or NULLs that prevent the conversion. For instance, commas and dashes may appear in numeric fields. BI tools often get the commas right (but not always), but it doesn't know what to do with dashes.
Conclusion
Hopefully, you got a sense from this article about how important knowing your data is in the analysis process. Clean data is the friend of any BI tool, but data seldom arrives clean. Knowing a few common patterns can help you identify the steps needed to clean your data and to help you set up a proper data model.
Transform Your Analysis Now!
If you haven't learned about Power BI and how it can transform your analysis, you are not getting the most out of your efforts. But Power BI is not as easy as it seems to learn. Unless you have the right training.


