Why DAX Exists: Measures as Templates and Windows as Context
Do you struggle with DAX? If so, you’re not alone. The hardest part with DAX isn’t the syntax. It’s conceptualizing it mentally. What does “filter context” really mean? Why does a measure give different results in different visuals? When people first encounter DAX, they often ask: “Why do we need a whole new formula language? […]
Continue readingData Sources

Please note: we do not manage or maintain these resources (unless otherwise stated). Resources subject to change without notice. Also, some resources lead to more listings of sources rather than data itself. No guarantee of timely updates, either. General Google Scholar PEW Research Amazon AWS Data Sources Journalism.org Datasets CIA World FactBook Project Gutenberg SSRN KDNuggets […]
Continue readingCreate Stock Charts in Two Lines of Code
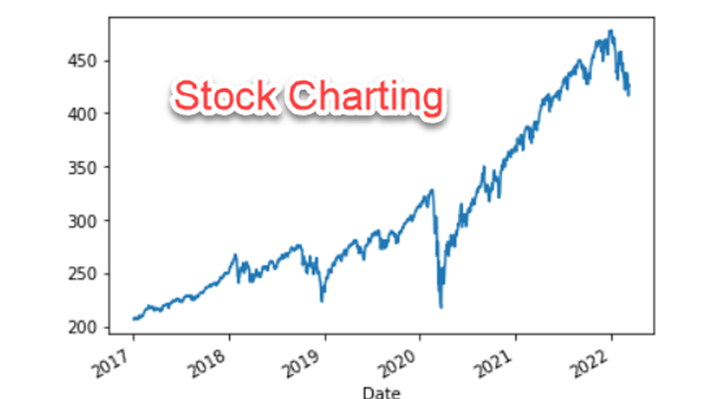
Creating stock charts requires expensive software, or at least it used to. Now, you can simply create it right from a programming languages. Even better, you can do it all in two lines of code. Nice! What’s the Catch? There really isn’t a catch. Of course, if you are expecting these charts to have all […]
Continue readingGrasping Loc and iLoc in Pandas
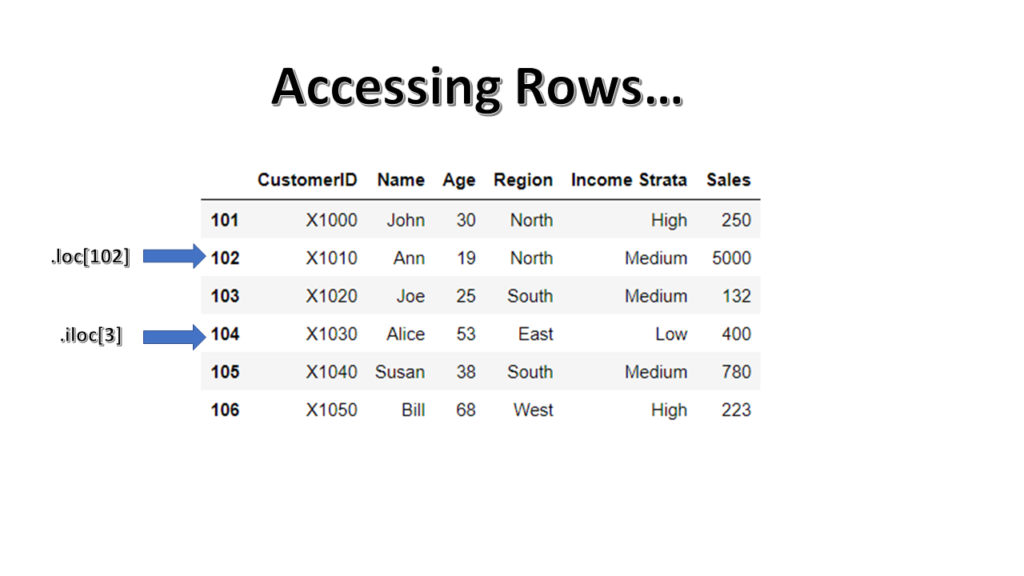
Are you struggling with loc[] and iloc[] in Pandas? If so, you are in the right place. Read about grasping loc[] and iloc[].
Continue readingWhat Skills Do You Need for Data Analysis?
You know already that data is everywhere. But do you know how to use it? You’ll learn about a resource that will help you learn.
Continue readingThe Four Core DAX Measures

When I first started working with Power BI, I often heard that you could get by with just four core DAX measures: Total Sales, Total Cost, Total Profit, and Profit Margin. At the time, that advice felt empowering—keep it simple and you’ll cover most reporting needs. But as I gained experience, I realized that framing is […]
Continue readingCreate Lookup Tables from Fact Tables Using Merge in Power BI

When analyzing data, analysts should adhere to best practices. Once such best practice is to use a star schema for the data. At its basic level, a star schema contains one or more fact tables, and several lookup tables. But data often doesn’t come to the analyst as a star schema, which means the analyst […]
Continue readingHow to Get Familiar with Your Data
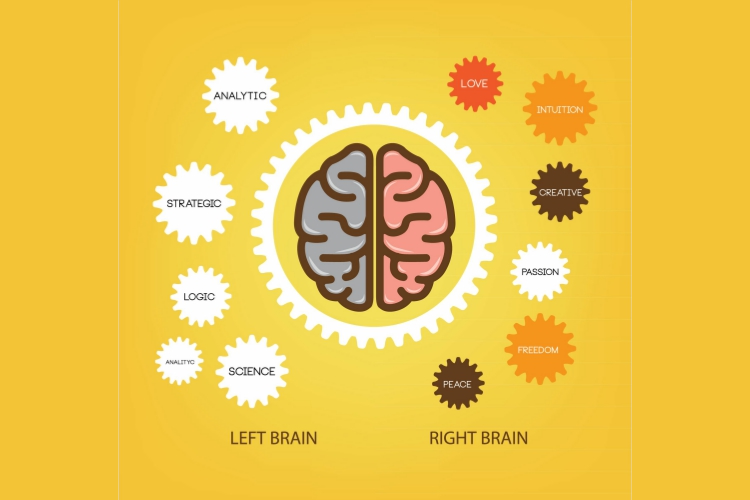
Let’s face it. Looking at data sometimes can be a nightmare. It never seems to conform to the neatly laid out samples from training modules. Often, the data you obtain is a scattered mess. How do you make sense of it all? This article will help learn how to get familiar with your data.The variety […]
Continue readingWhy Data Analysts Need a Data Transformation Process

Do you know what clean data looks like? Learn why data analysts need a data transformation process.
Continue readingWhat’s the Big Deal About Filter Context in Power BI?
What’s the Big Deal About Filter Conext n Power BI? It’s a really important concept, one that you’ll need to take your analytics to the next level. Don’t miss this critical training module!
Continue reading