There's something about statistics and baseball. They seem well-suited for one another. It's been that way since the inception of the game. People have been keeping not only the scores of the games and teams, but also the scores of the players in the form of statistics.
This leads to managing a seriously large amount of baseball data. In some form or another, baseball data has been tracked since about 1871. When you factor in the number of teams and the number of players and managers, it can get quite overwhelming to perform analysis. What we can do is break down the data into manageable components and for that we can use Dplyr in R to subset baseball data.

You can certainly uses the native subset command in R to do this as well. I just find the Dplyr package to be more intuitive. Besides, Dplyr can aggregate and mutate the dataset. I believe that since it is a C Library, it's faster than the native subset, too. But, it also has joining capabilities when dealing with multiple data sets that are related in some way.
This short tutorial assumes you already know the basics of R programming.
What if you could predict baseball games before the games were even played? It's not possible with a software package. Learn about my season-long experiment where I put the software to test.
--- Click to Learn About the Baseball Prediction Software Experiment ---
First up, is making sure you have the package installed. As you probably know, you can use the install.packages command as follows:
install.packages("dplyr")
Then, load it:
library(dplyr)
If you don't have the Lahman package installed, I suggest you do so now. This is the package that gives us access to baseball data for several years starting in 1871. The package usually lags by about a year when loading in this manner. If you want more up-to-date data, you'll have to use the CSV files or the Access database, which the 2018 season is available for download.
After installing your packages you can load them as follows:
library(dplyr)
library(Lahman)
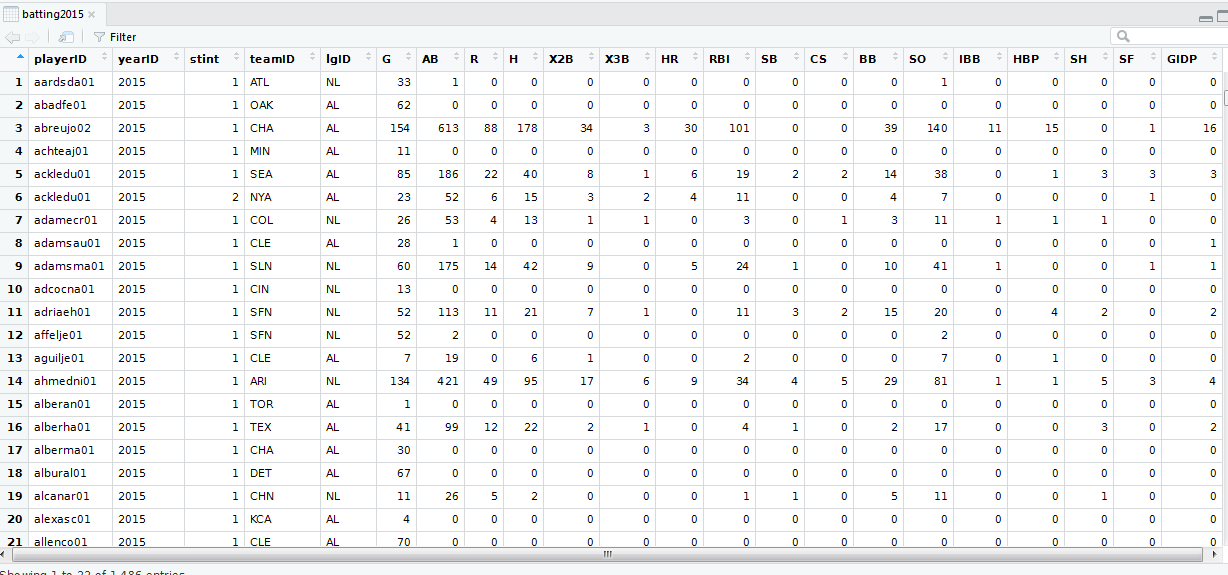
Suppose you want batting data for the year 2015. You can accomplish this with the following:
batting2015 <- Batting %>% filter(yearID == 2015)

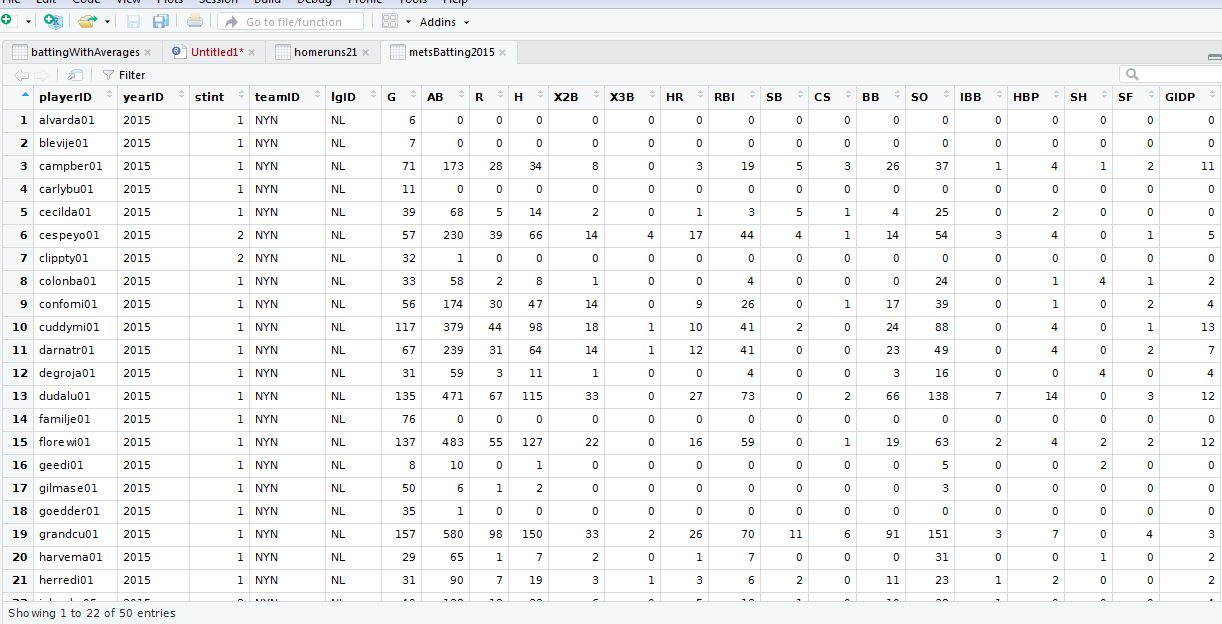
If you wanted batting for the Mets in 2015, you can either filter the new data set (batting 2015) or you can use multiple filters as follows:
metsBatting2015 <- Batting %>% filter(yearID == 2015, teamID == "NYN")

Note: if you are unfamiliar with the funky symbol %>%,, it's called a pipe operator. It's a convenient shorthand for the first parameter of a command. Without it, we would need to do the following:
batting2015 <- filter(Batting, yearID == 2015)
NOTE: the pipe operator is not native to R. It is part of the magrittr package. It's also included for your convenience when you load the dplyr package.
While for small queries such as the above, the shorthand form may not be needed. But, when you start nesting groups with aggregations and filters, etc., the shorthand form comes in handy. Trust me on this one.
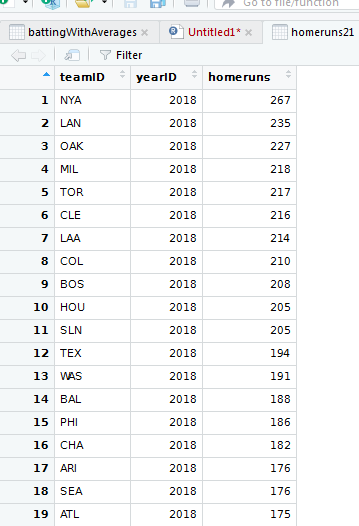
As an example, suppose you want to find the total number of home runs by team by year for all teams on or after 2000. You can accomplish this with following command:
homeruns21 <- Batting %>%
filter(yearID >= 2000) %>%
group_by(teamID, yearID) %>%
summarize(homeruns = sum(HR)) %>%
arrange(desc(yearID), desc(homeruns))
The great aspect of Dplyr is it's quite intuitive. You should be able to decipher from the command above that we want homeruns by team, by year starting with the year 2000 sorted in descending order by year and homeruns. The summarize command creates a new variable for the dataset called homeruns which appropriately contains the sum of homeruns by team by year.

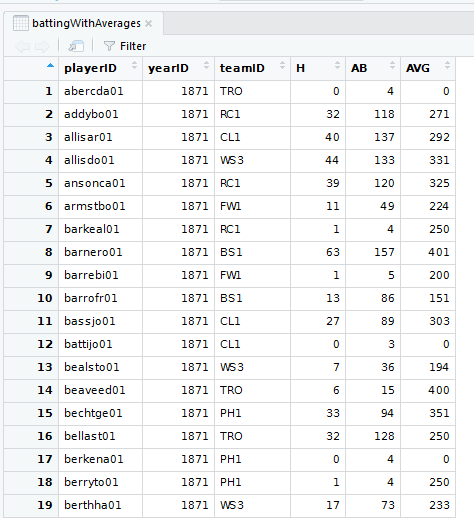
Suppose you didn't need aggregation like the above examples, but you want to work only with the variables you need in your data set. For instance, in the Batting table, there is no calculation for average. Many baseball fans like to use average to measure how well a batter can hit. Whether average is a good measure is not the issue. I specify it here as it is not a complicated measurement.
We can create a trimmed-down data set with keeping the playerID, yearID, teamID, H (hits), and AB (at bats). We can also add the AVG which is calculated as H / AB. We can accomplish all of this as follows:
battingWithAverages <- Batting %>%
select(playerID, yearID, teamID, H, AB) %>%
mutate(AVG = round(H / AB * 1000, 0))
Some people like to keep the decimal point as part of the average. If so, simply remove the * 1000 in the equation. It's a matter of preference.

Conclusion
I like to keep the coding sections on this website small which makes them good reference sections. Therefore, this seems like a good place to stop. I could have continued with joins on the Team or the Master (now People) tables. For instance, instead of using the team ID, the team name could be displayed which makes reporting less cryptic. I will include a future module that handles joins.

