This post is a summary of the OOTP Prediction to April 19. I decided not to include the first few games in March as much of the stats for those predictions were based on the previous season. By April, this gave the teams enough time to find their grove (or not). But, it starts being less about last season's playing.
OOTP stands for Out of the Park Baseball. It is a simulation package where users can manage baseball teams with real statistics.

To recap, I was making predictions on a daily basis. Over time, there weren't significant differences and visitors seemed to visit only once per week. Therefore, I've decided to do weekly summaries on the predictions. I will continue to run the predictions on a daily basis and track them against actual results.
From the first of April until the 19th (inclusive), the average wins was just north of 58%. While this is above 50/50, it isn't far from even. The implications are that at least 40% of the predictions will be wrong.
Artificial Intellegence (AI) Engines Should Improve
Over time, AI engines should improve. The concept is for the algorithm to learn and use that learning to get better. OOTP touts itself as an AI engine. I get that it is still early in the season. April is not yet over. But, with teams playing well over 15 games each, that should be enough for the engine to start its improvement process.
Want Your Own Copy of the Latest Version of Out of the Park Baseball? I am authorized to sell this software and you can obtain your copy here. If you purchase through this website, I will receive a commission. The price is not affected by this arrangement and it helps in a small way to keep this website rolling. Besides, it's a fun game to play!
As data science is about recognizing patterns, I decided to try to look for patterns with how the simulator predicted its teams. Over these 19 days, I created three categories for the predictions. These include teams that were::
NOTE: I decided against including a category for Predicted to Lose and Lost. I did not feel there was much value in reporting this.
Predicted to Win and Won
Obviously, this is the best category for the simulator. This means it predicted the team to win and the team won. The Houston Astros seemed to be the best for the simulator with 12 wins correctly predicted.
As you can see, the Houston Astros appears to be in the lead for the number of games that OOTP predicted to win and the team won. Out of 13 games that Houston as won (since the 19th) OOTP predicted 12 of them correctly. Cleveland is a close second with the simulator predicting 10 wins taking 11 games (as of the 19th).
As of the 19th, the Los Angeles Dodgers had won 14 games, but OOTP only predicted 9 of those. This is exactly the same scenario for the Tampa Bay Rays. The Rays have been on a tear, but the simulator isn't keeping up with this development.
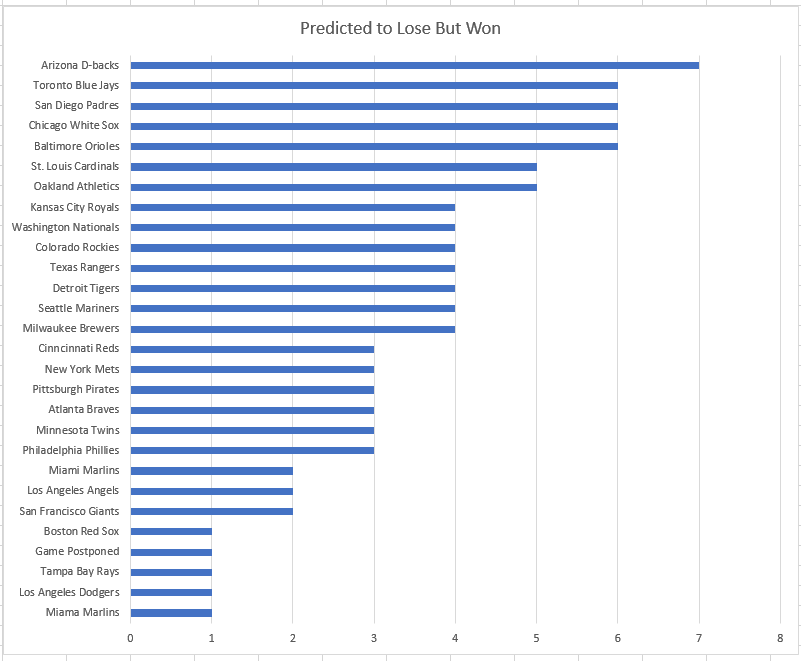
Predicted to Lose But Won
The Arizona Diamondbacks were predicted to lose 7 of its 10 wins and it ended up winning those games. The simulator did not have faith in the team, but clearly the team proved the engine wrong.
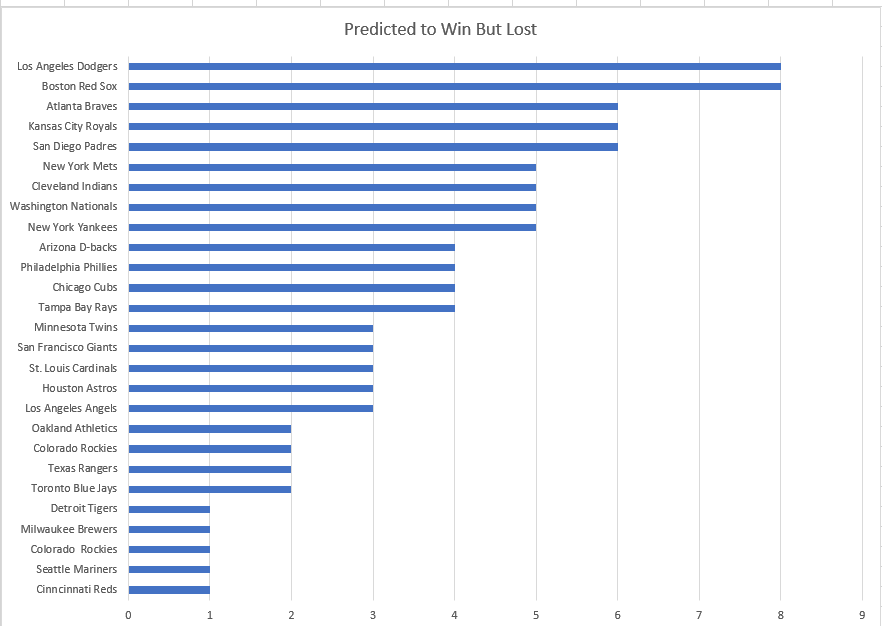
Predicted to Win But Lost
The simulator was stubborn with Boston as you can see from the chart. The team has not been able to get their act together. I don't know if the algorithm was relying too much on last year's stats, even as more games were played. Again, I realize it is still early in the season. But, most other teams seem to be finding their mojo. I also realize that it's not a given for a team that won the previous year to win again the following year. But, I don't think anyone thought Boston would be this down in the dumps so far into the season.
The Los Angeles Dodgers are in the same boat for this category. I don't think I would have realized this without running the analysis on these three categories.
The next update will be an end-of-month update since we're getting close to that point in time, anyway. I may decide to add the Predicted to Lose and Lost category. It may add some insight that isn't shown above. When I do this analysis next, it will be for the entire month of April. This means I will need to wait to get the scores for April 30th games. My projected date is May 1st, but it could go a little past that.
Correlation Between Strength Indicator and Predictions
I was hoping to find a correlation between the strength indicators and the predictions. While I didn't run the correlations via the formula in Excel, I could see that the correlations would not be strong, if any. As a reminder, the strength indicator is the sum of the total scores divided by the sum of the runs allowed. My gut feeling would have been that the simulator predicted more teams with high strength indicators as the winners. But, this wasn't necessarily the case. I took an average of the strength indicators for each day and high indicators were associated with predictions of less than 50% on a few occasions. The opposite is true as well, i.e., low strength indicators associated with a high number of correct predictions. It will be interesting to see if this continues to be the case as the season progresses.


