Do you struggle with DAX? If so, you’re not alone. The hardest part with DAX isn’t the syntax. It’s conceptualizing it mentally. What does “filter context” really mean? Why does a measure give different results in different visuals?

When people first encounter DAX, they often ask: “Why do we need a whole new formula language? Why not just use Excel?”
The short answer: DAX was created to let you define a calculation once and reuse it across endless combinations of filters.
An example can help to clarify this concept:
From Transactions to Aggregates
Many datasets come in the form of transactions. For instance, here is a Sales table (with only two quarters of data for simplicity):
| Date | Region | Salesperson | Product | Amount |
|---|---|---|---|---|
| Jan 14 | East | Alice | Widget | 5,000 |
| Jan 20 | East | Alice | Gadget | 3,000 |
| Feb 5 | East | Alice | Widget | 24,000 |
| Feb 11 | East | Bob | Gadget | 8,000 |
| Mar 2 | West | Charlie | Widget | 10,000 |
| Mar 15 | West | Charlie | Gadget | 7,000 |
| Apr 4 | East | Alice | Widget | 12,000 |
| Apr 18 | West | Bob | Gadget | 9,000 |
| May 9 | East | Alice | Gadget | 6,000 |
| Jun 22 | West | Charlie | Widget | 14,000 |
This information isn’t very useful to managers. They want their data rolled up into aggregations:
| Quarter | Region | Salesperson | Total Sales |
|---|---|---|---|
| Q1 | East | Alice | 32,000 |
| Q1 | East | Bob | 8,000 |
| Q1 | West | Charlie | 17,000 |
| Q2 | East | Alice | 18,000 |
| Q2 | West | Bob | 9,000 |
| Q2 | West | Charlie | 14,000 |
A Note on Schema
For simplicity, I’ve shown a denormalized table here. In real-world models, you should always build a star schema:
- A fact table with amounts and keys.
- Separate dimension tables (Date, Product, Region, Salesperson).
(Side note: under the hood, Power BI’s storage engine still “reassembles” something like a big denormalized table during queries, but it does so with highly efficient columnar scans.)
To accomplish the aggregations in the second table in a traditional spreadsheet, we’d have to create the aggregated formulas (in this case, SUM() functions) for each of the buckets in the Total Sales column.
But what if you could create a Total Sales “placeholder” and then whenever you add it to a report, it figures out based on the context of the data what the number should be?
That is essentially what a DAX measure does for you. We define a DAX “template,” if you will, and then let the engine discover the context (Quarter 1, Region, Salespersons, etc.) and then fill in the values based on that context.
Here is what a simple template (DAX) might look like for Total Sales:
Total Sales := SUM(Sales[Amount])This measure gets replayed for each slice of the data:
Q1, East, Alice = $32,000 (one replay of the template)
Q1, East, Bob = $8,000 (another replay of the template)
Note: the word “template” used in this capacity isn’t official, and under the hood, DAX likely does something different. But this is how I think of it conceptually, and it has really helped me get over the learning curve hump of DAX, IMHO.
Measures Are Templates
Think of a DAX measure like a recipe card.
% of Total Sales :=
DIVIDE(
    [Total Sales],
    CALCULATE([Total Sales], ALL(Sales[Product]))
)
The recipe says:
- Grab total sales in the current context.
- Grab total sales with the Product filter removed.
- Divide them.
The recipe doesn’t care whether the current context is Q1, East, Alice, or all three together. It just runs with whatever “ingredients” it’s given.
Context as a Window
Now here’s where people often stumble.
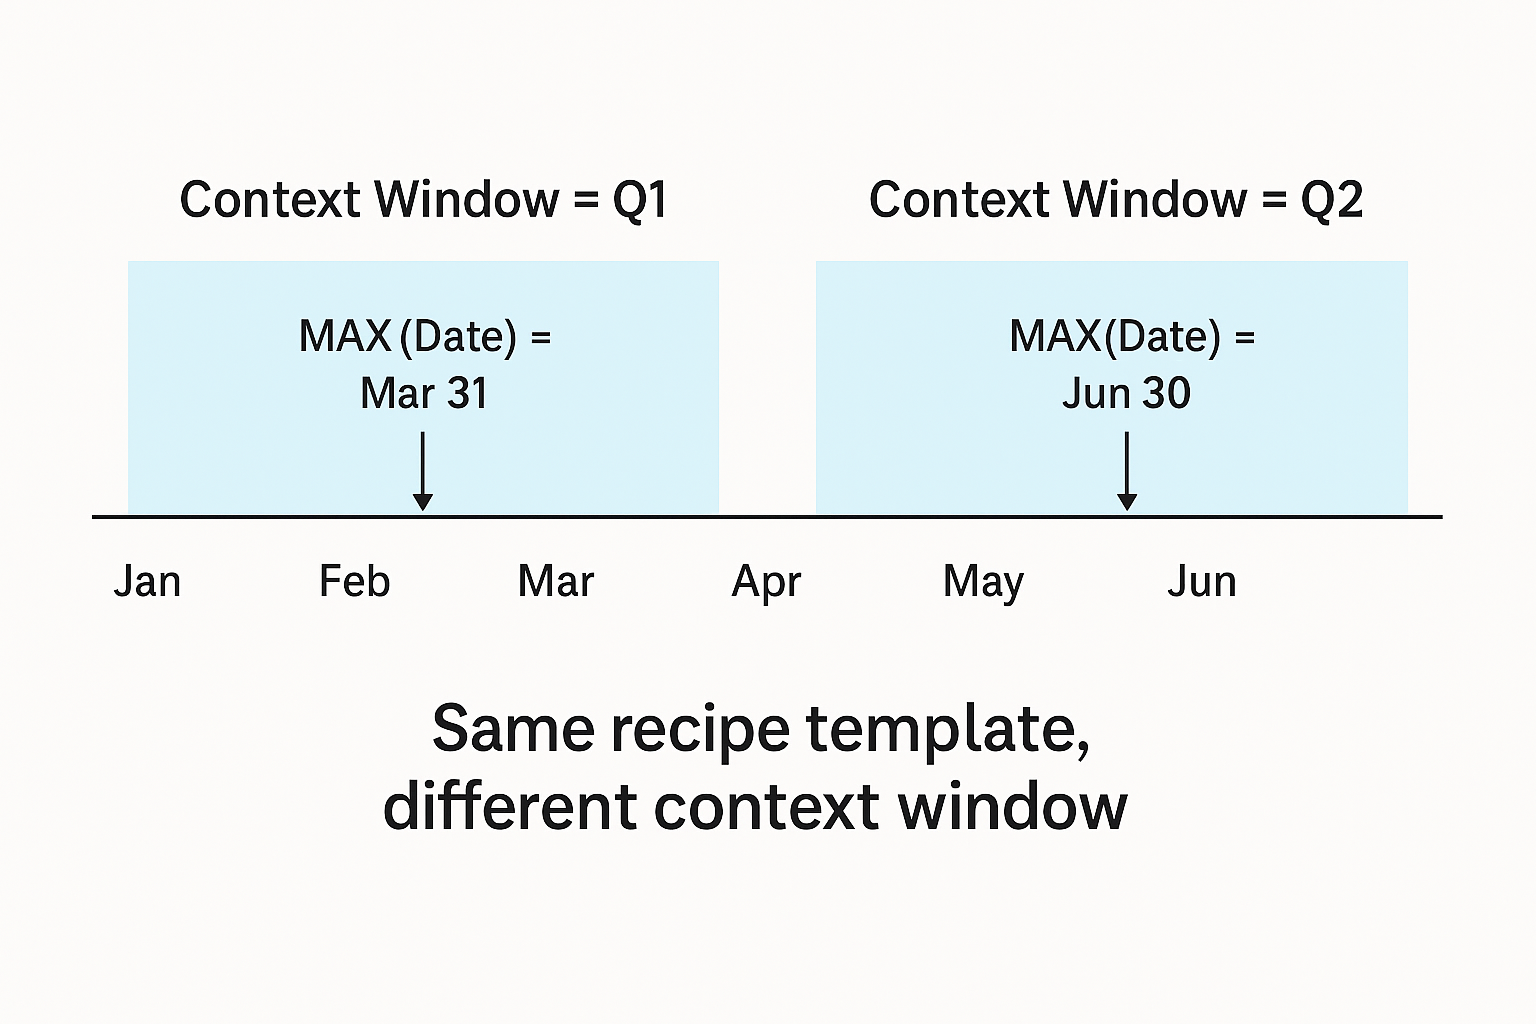
Take this measure:
MAX(Sales[Date])Inside Q1, it doesn’t return the latest date in the whole dataset. It returns the latest date within Q1’s filter window (March 31).
Shift the window to Q2, and the result changes to June 30.
Context = a moving window over the data.
Each measure is replayed inside that window.
Visualizing the Window
Why DAX Exists
At its core, DAX was created to:
- Define calculations once.
- Reuse them dynamically across any filter combination.
- Let analysts and managers move seamlessly from raw transactions to aggregated insights.
The trade-off? You have to understand context. Measures are powerful because they’re templates — but you must always ask: “What’s the current window of data I’m looking through?”
Final Thought
DAX isn’t just another formula language. It’s the glue between transactional data and management-ready insight. Once you see measures as recipes replayed inside windows of context, the fog lifts:
You write it once. Power BI cooks it thousands of times.


Be First to Comment